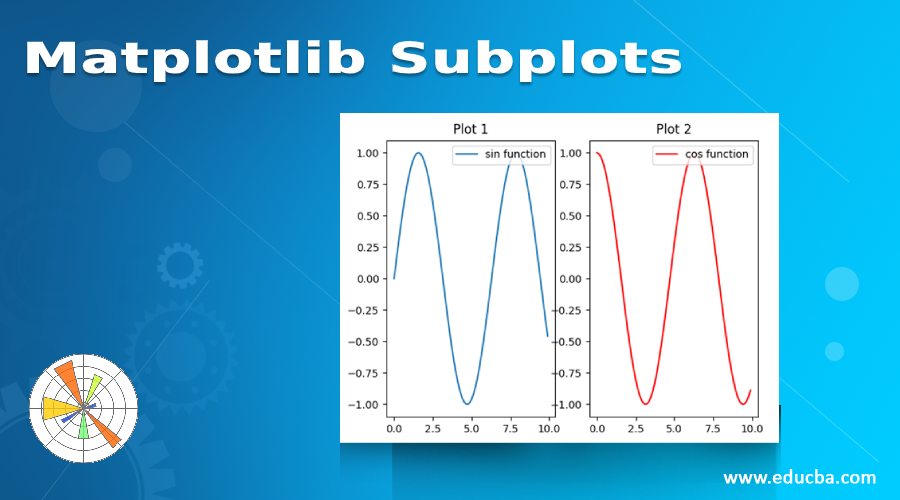
pyplot.subplots creates a figure and a grid of subplots with a single call, while providing reasonable control over how the individual plots are created. For more advanced use cases you can use GridSpec for a more general subplot layout or Figure.add_subplot for adding subplots at arbitrary locations within the figure.
https://matplotlib.org/stable/gallery/subplots_axes_and_figures/subplots_demo.html
matplotlib.pyplot.subplots
matplotlib.pyplot.subplots(nrows=1, ncols=1, *, sharex=False, sharey=False, squeeze=True, subplot_kw=None, gridspec_kw=None, **fig_kw)
Returns:
fig: The matplotlib.pyplot.figure object to be used as a container for all the subplots.

