(Collection) LCA of plastic or packaging waste
Table of Contents
Life cycle assessment of end-of-life treatments of waste plastics in China
Resources, Conservation and Recycling
Received 28 December 2018, Revised 8 March 2019, Accepted 8 March 2019, Available online** 6 April 2019**.
Yuedong Chen $^a$, Zhaojie Cui $^a$, Xiaowei Cui $^b$, Wei Liu $^a$, Xinlei Wang $^a$, XinXin Li $^a$, Shouxiu Li $^a$
$^a$ School of Environmental Science and Engineering, Shandong University, Qingdao 266237, China
$^b$ School of Environmental Science and Engineering, Shanghai Jiao Tong University, Shanghai 200240, China
Highlights
- Environmental impacts of EOL treatments were assessed based on the components and treatment pattern of waste plastics.
- EOL treatments of waste plastics bring environmental benefits to China.
- Mechanical recycling plays the most beneficial role in EOL treatments.
- Scenarios are set to analyse the potential reduction of environmental impacts for waste plastics.
Abstract
Achieving net-zero greenhouse gas emission plastics by a circular carbon economy
Research article from Science
30 Sep 2021
RAOUL MEYS $^{1,2}$, ARNE KÄTELHÖN $^{1,2}$, MARVIN BACHMANN $^1$, BENEDIKT WINTER $^{1,3}$, CHRISTIAN ZIBUNAS $^1$, SANGWON SUH $^4$, ANDRÉ BARDOW $^{1,3,5}$
$^1$ Institute for Technical Thermodynamics, RWTH Aachen University, Schinkelstr. 8, 52062 Aachen, Germany.
$^2$ Carbon Minds GmbH, 50933 Cologne, Germany.
$^3$ Energy and Process Systems Engineering, ETH Zürich, 8092 Zürich, Switzerland.
$^4$ Bren School of Environmental Science and Management, University of California, Santa Barbara, CA, USA.
$^5$ Institute of Energy and Climate Research–Energy Systems Engineering (IEK-10), Forschungszentrum Jülich GmbH, Jülich, Germany.
Abstract
- Implementation of circular technologies in the plastics supply chain: (i) chemical and mechanical recycling, (ii) biomass utilization, and (iii) carbon capture and utilization (CCU)—to exchange the fossil carbon feedstock.
- Our study shows that by combining recycling, biomass utilization, and CCU, net-zero GHG emission plastics could be achieved with lower energy demands and lower operational costs than those associated with current fossil-based production technologies combined with carbon capture and storage (CCS).
- We built and used a global bottom-up model for plastics production and waste treatment based on >400, mostly industrially validated, life-cycle assessment compliant and harmonized technology datasets representing the life cycle of >90% of global plastics.
- We project five pathways for life-cycle GHG emissions of plastic from “cradle-to-grave” in the year 2050.
- Two scenarios for fossil-based plastic waste treatment: landfilling and energy recovery (represented by the linear carbon pathway).

Fig. 1. Potential reductions of global GHG emissions of plastics by four circular pathways in 2050.(A) Reductions of life-cycle GHG emissions from “cradle-to-grave” of the four pathways—recycling (Rec.), biomass (Bio), carbon capture and utilization (CCU), and the circular carbon pathway (Optimal)—depending on the electricity carbon footprint. av., average. (B) Remaining GHG emissions of the linear carbon pathways and the four circular pathways, depending on the carbon intensity of electricity. The GHG emissions of the linear carbon pathway are not altered as a result of decreased electricity climate impacts, because all electricity is supplied from the energy recovery via plastic waste incineration. (C) Optimal carbon input in percentage of the circular carbon pathway, depending on the carbon intensity of electricity. The IEA report (28) provides only regionalized electricity impacts until 2040. (D) Feedstock supply and waste treatment of the circular carbon pathway for wind-based electricity production with 7 g of CO2-equiv per kWh. Line width and corresponding values represent the carbon content (million tons of C) of the flows.
- Overall, plastics solely based on recycling, biomass utilization, or CCU fail to reach net-zero GHG emissions, even for wind-based electricity production.
- Even recycling rates are maximized, all recycling processes produce residual wastes, leading to GHG emissions.
- Biomass cultivation emits noncarbon GHGs (e.g. nitrous oxide) that co2 uptake cannot counterbalance.
- Even in the most ambitious scenarios of the IEA, renewable electricity production is not entirely net zero by 2050, with ~13.5 g of CO2-equiv per kWh.
- The unavoidable emission in the optimal circular pathway is caused by landfilling (permanent carbon storage in landfills).
- Technologies and carbon feedstocks that minimize GHG emissions of plastics depend on the electricity supply's carbon intensity.
- Break-even points for the carbon footprint of electricity supple: CCU becomes climate beneficial compared with the recycling (39.5g of co2-equiv per kWh) and biomass (5.8g of co2-equiv per kWh) pathways.
- Over 8.6 g of CO2-equiv per kWh, the optimal pathway is solely based on biomass and plastic waste as carbon feedstock.
Renewable resource demands

Fig. 2. Demand for biomass and electricity to achieve net-zero emission plastics in 2050. Data for the circular carbon pathway are shown together with those for the linear carbon and recycling pathways with CCS. The range of CCS reflects different sources of CO2, such as ammonia plants (34) or ambient air (35). The energy demands for the linear carbon scenarios are based on fossil resources, which are converted to biomass and electricity on an energy basis. The marker annotated with “Fig. 1D” refers to the Sankey diagram in Fig. 1. In both cases, the same amount of electricity and biomass are used.
- The resource demands can be shifted between biomass and renewable electricity because both CCU and biomass can achieve net-zero emission plastics in combination with recycling.
- 2.7 PWh of electricity is assumed to be supplied to plastics life cycles as plastic production accounts for ~80% of the overall mass of the major bulk chemicals.
- Only sufficient plastic waste is collected and made available that promising recycling technologies at low technology readiness levels (chemical recycling, biomass utilization, and CCU technologies) can leverage their potential.
- Landfill bans have proven highly effective in EU countries e.g. Germany, the Netherlands, and Sweden, while a proper waste management infrastructure is missing in many low- and middle-income countries.
- To gain access to these untapped resources, we should increase the profitability of material recycling through investments in waste management infrastructure and improved coordination for collection, sorting and management of plastic wastes.
Policies for circular and net-zero emission plastics
- Two crucial technological changes achieving net-zero emission plastics: (i) increase plastic recycling rates and supply more plastic waste feedstock, and (ii) deploy CCU or biomass technologies, depending on local availabilities of renewable electricity and biomass.
- Current EU ETSs exclude end-of-life management processes such as incineration from the scope. Including plastic waste incineration in emission pricing schemes through, e.g., extended producer responsibility policy would be a step forward to incentivize recycling. The entire life cycle of plastics must be covered within the scope of carbon pricing.
- A deposit system for plastic materials could provide a potential avenue for consumers to provide valuable plastic waste feedstock directly from the start.
- Compared to subsidy in oil exploration and production of fossil products, low return on investment of renewable carbon feedstocks including plastic waste and biomass.
- Balance with other environmental impacts of large-scale usage of biomass (terrestrial acidification1 and water eutrophication) and renewable electricity (metal depletion and water consumption for solar and wind-based power plants).
Life cycle environmental impacts of chemical recycling via pyrolysis of mixed plastic waste in comparison with mechanical recycling and energy recovery
Science of The Total Environment
Received 4 November 2020, Revised 7 December 2020, Accepted 9 December 2020, Available online 5 January 2021.
Harish Jeswani et al.
Department of Chemical Engineering and Analytical Science, The University of Manchester, Sackville Street, M13 9PL, UK
Abstract
A large portion of plastic produced each year is used to make single-use packaging and other short-lived consumer products that are discarded quickly, creating significant amounts of waste. It is important that such waste be managed appropriately in line with circular-economy principles. One option for managing plastic waste is chemical recycling via pyrolysis, which can convert it back into chemical feedstock that can then be used to manufacture virgin-quality polymers. However, given that this is an emerging technology not yet used widely in practice, it is not clear if pyrolysis of waste plastics is sustainable on a life cycle basis and how it compares to other plastics waste management options as well as to the production of virgin plastics. Therefore, this study uses life cycle assessment (LCA) to compare the environmental impacts of chemical recycling of mixed plastic waste (MPW) via pyrolysis with the established waste management alternatives: mechanical recycling and energy recovery. Three LCA studies have been carried out under three perspectives: waste, product and a combination of the two. To ensure robust comparisons, the impacts have been estimated using two impact assessment methods: Environmental footprint and ReCiPe. The results suggest that chemical recycling via pyrolysis has a 50% lower climate change impact and life cycle energy use than the energy recovery option. The climate change impact and energy use of pyrolysis and mechanical recycling of MPW are similar if the quality of the recyclate is taken into account. Furthermore, MPW recycled by pyrolysis has a significantly lower climate change impact (−0.45 vs 1.89 t CO2 eq./t plastic) than the equivalent made from virgin fossil resources. However, pyrolysis has significantly higher other impacts than mechanical recycling, energy recovery and production of virgin plastics. Sensitivity analyses show that some assumptions have notable effects on the results, including the assumed geographical region and its energy mix, carbon conversion efficiency of pyrolysis and recyclate quality. These results will be of interest to the chemical, plastics and waste industries, as well as to policy makers.
2. Methods
1. Introduction
- Currently only one-third of post-consumer plastic waste in Europe is collected for recycling, with the majority (43%) incinerated in waste-to-energy plants; the rest is still landfilled (PlasticsEurope, 2019).
- Plastics can be recycled using either mechanical or chemical recycling technologies.
- Mechanical recycling involves sorting, washing, shredding and melting of plastic waste to produce granulate and finally new plastic products (Ragaert et al., 2017). The main disadvantage is that the process can degrade the mechanical properties of plastic materials, meaning the mixed plastic waste is usually ‘down-cycled’ into secondary and less valuable products. Inefficient for difficult-to-recycle plastics, e.g. multi-layered or heterogeneous plastic used. It still leaves residual materials to be incinerated or landfilled.
Supplementary file
CO2 supply
Three options: 1) co2 supply from chemical and plastic production, e.g. capturing co2 from ammonia, ethylene oxide, hydrogen-producing plants, and biomass fermentation and gasification. 2) capturing CO2 from waste incinerators for production residuals and plastic wastes. 3) capturing CO2 directly from ambient air. Fossil based power plants are excluded.
Biomass supply
Foucusing on lignocellulosic feedstock: wood chips (木屑), bark chips (树皮片), wood pellets (木屑颗粒), miscanthus (芒草), or sugarcane bagasse (甘蔗渣). GHG emissions for the lignocellulose feedstock were taken from ecoinvent 3.6 and corrected by the uptake of biogenic CO2.
End-of-life technologies
- Three options exist to treat plastic waste: landfilling, incineration (e.g., energy recovery), and recycling.
- Plastic packaging waste can be recycled mechanically efficiently if sorted and few impurities in.
- Chemical recycling ways involve pyrolysis and steam-cracking (naphtha).
Pathway definition
- Four circular pathways: (1) the recycling pathway, (2) the biomass pathway, (3) the CCU pathway, and (4) the circular-carbon pathway. Each of them has a high (commercialized) and low technology readiness level.
- Using fossil-based linear-carbon pathway as a reference.
Recycling pathway
Including energy recovery, chemical recycling, and mechanical recycling. The landfilling rate is fixed to 6%.
High-TRL technologies: sorting of plastic packaging waste, mechanical recycling of sorted plastic packaging waste, pyrolysis of unsorted or sorted plastic wastes, and the incineration of all plastic wastes with energy recovery. Low-TRL technologies: chemical recycling of all plastic wastes to their respective monomer chemicals.
Biomass pathway
Established by the incineration and release of CO2 to the atmosphere and the biomass’s CO2 uptake.
High-TRL technologies: biomass gasification to produce synthesis gas, steam production from biomass, and lignocellulose hydrolysis to sugar and subsequent fermentation to ethanol. No low-TRL technologies are considered.
CCU pathway
Via the incineration of plastic and the respective re-utilization of CO2.
High-TRL technologies: methanol and methane from CO2, direct air capture and electrified steam production.
Low-TRL technologies: benzene, toluene, p-xylene, mixed xylenes, carbon monoxide, ethylene oxide, ethylene, propylene, and styrene from CO2, as well as the ohmic heating to provide high-temperature thermal energy.
Circular-carbon pathway
Optimal combination of all the pathways above.
Strategies to reduce the global carbon footprint of plastics
Nature Climate Change
15 April 2019
Jiajia Zheng & Sangwon Suh
Bren School of Environmental Science and Management, University of California, Santa Barbara, CA, USA
Main
- A dataset covering ten conventional and five bio-based plastics and their life-cycle GHG emissions under various mitigation strategies.
- Mitigation strategies and combinations: 1. Bio-based plastics (fuel-based plastics will be phased out by 2050 and substituted by bio-based plastics); 2. Renewable energy (reach 100% renewables (wind power and biogas) by 2050); 3. Recycling (reach 100% by 2050);4. Reducing growth in demand (the annual growth falls from 4% to 2%).
Fig. 1: Global life-cycle GHG emissions of conventional plastics in 2015 by life-cycle stage and plastic type.
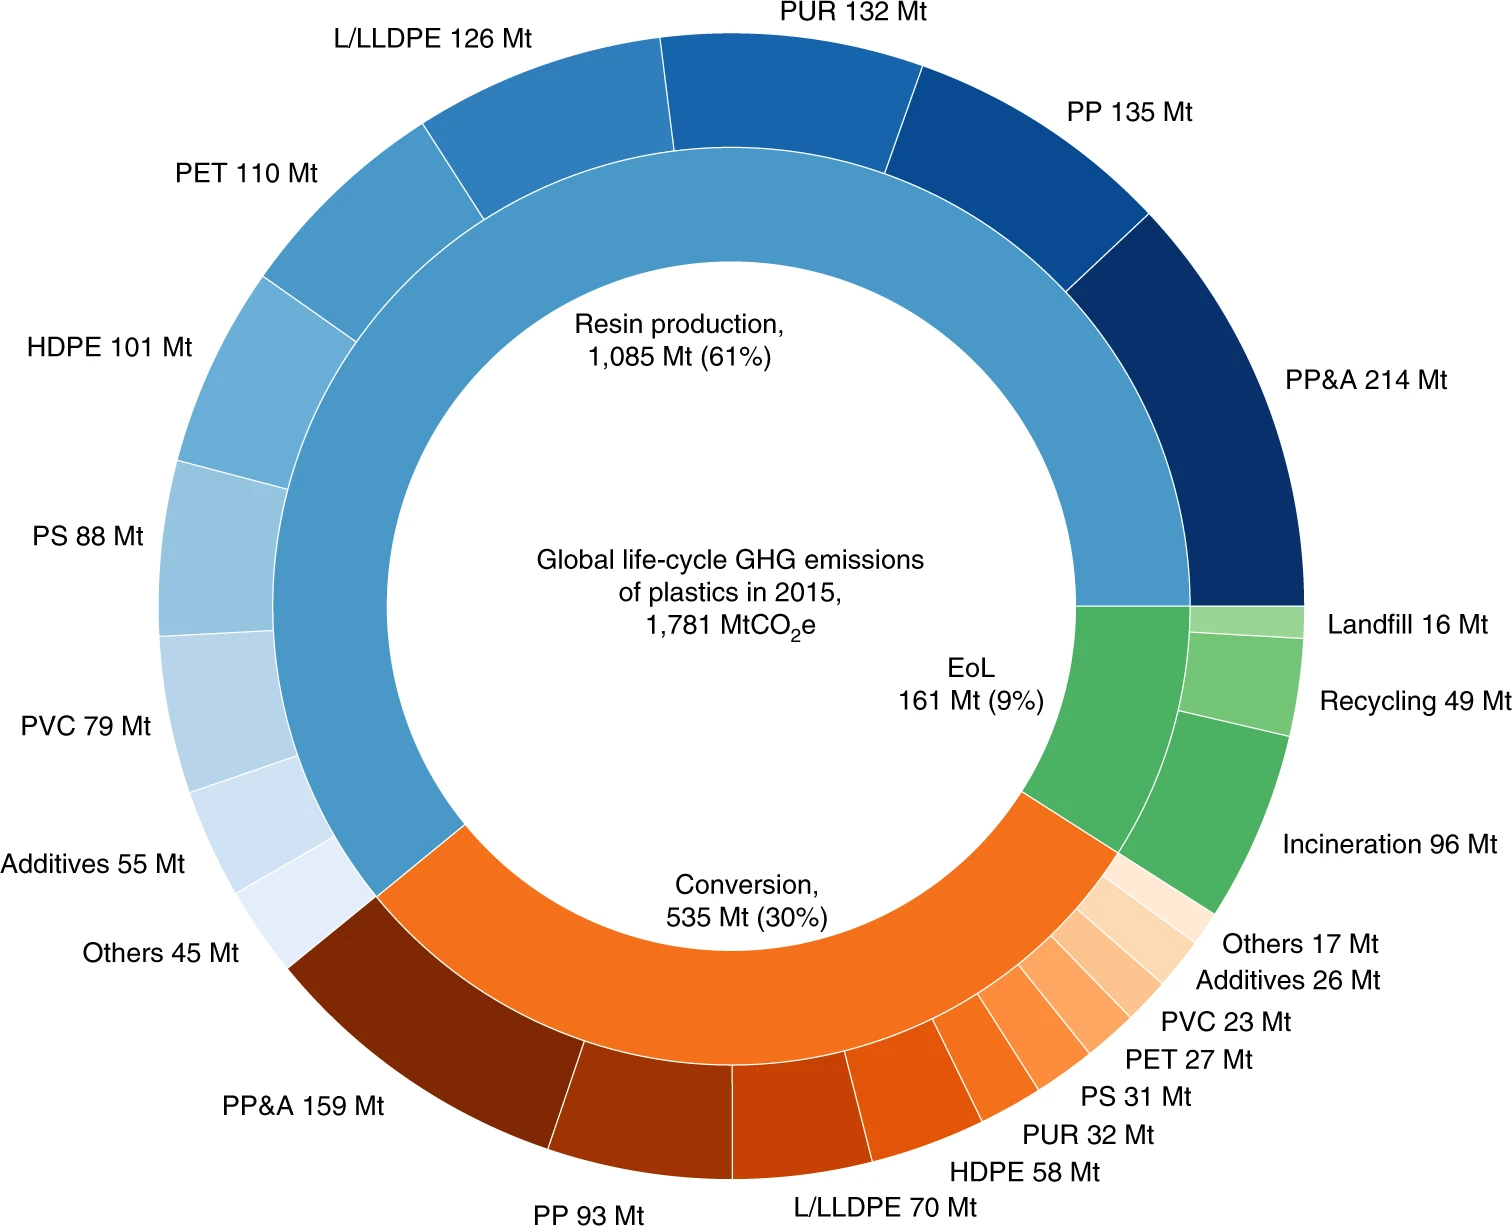
Carbon credits generated by recycling are not included. Blue, orange and green represent the resin-production, conversion and EoL-management stages, respectively. The emissions from each stage are broken down by plastic type or EoL-treatment method, indicated with different shades of the corresponding colour. PUR, polyurethane.
Fig. 2: Global life-cycle GHG emissions of plastics under scenarios of different feedstock sources, energy mixes, EoL management strategies and growth in plastics demand for 2015–2050.
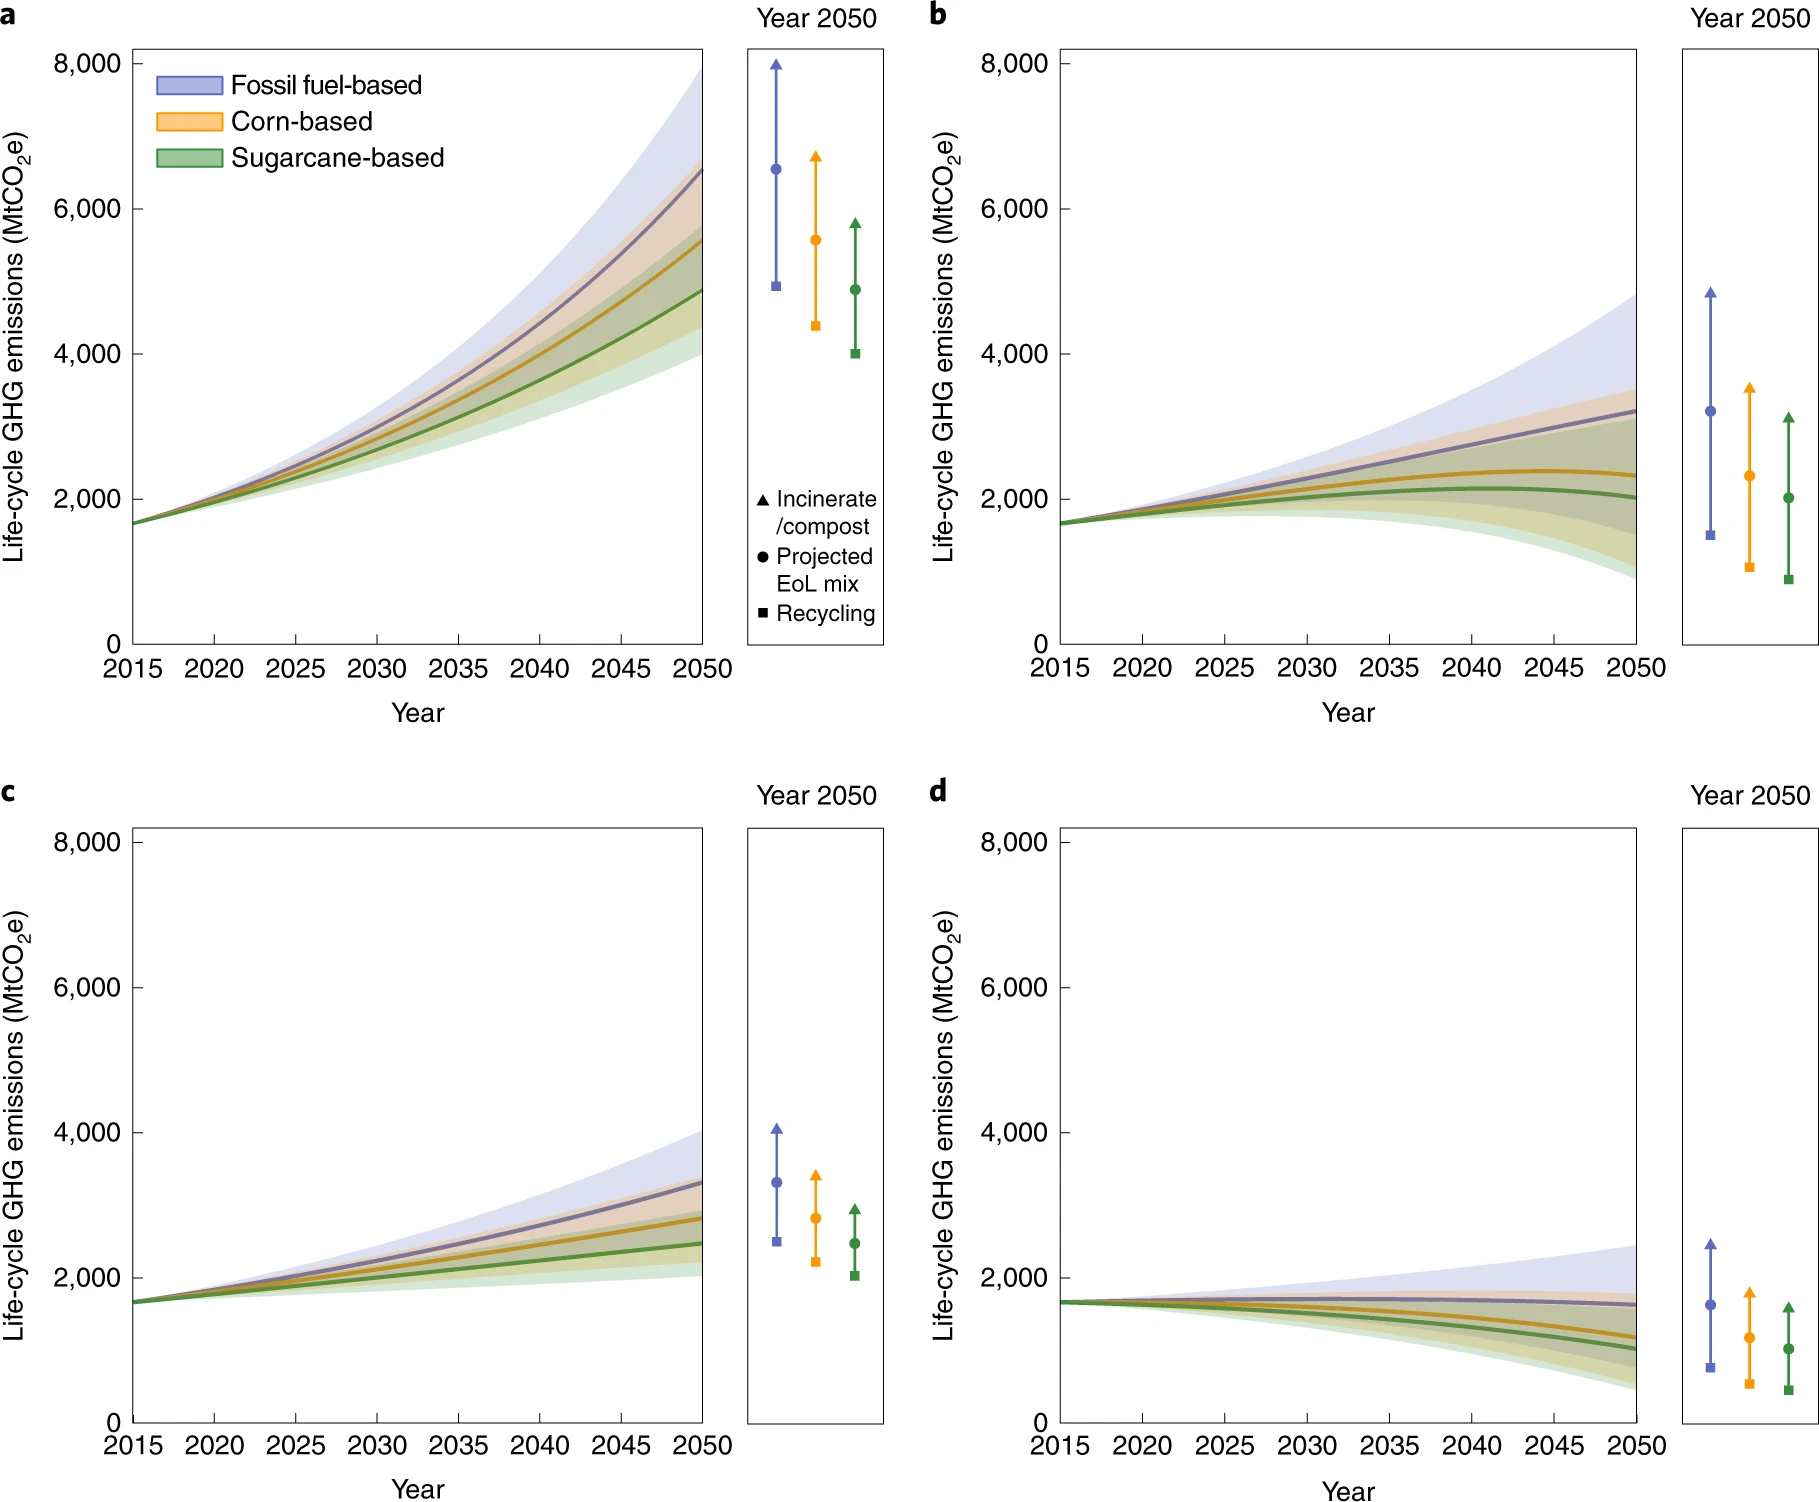
a, Plastics demand grows at 4% yr−1 under the current energy mix. b, Plastics demand grows at 4% yr−1, and the energy mix decarbonizes by 2050. c, Plastics demand grows at 2% yr−1 under the current energy mix. d, Plastics demand grows at 2% yr−1, and the energy mix decarbonizes by 2050.
Solid lines represent the projected EoL-management mix (Supplementary Table 10); whereas shaded areas represent ranges due to EoL options. The bars on the right side of each panel represent ranges due to different EoL options in 2050.
Fig. 3: GHG-emissions breakdown by life-cycle stage of plastics derived from different feedstock types under two energy-mix scenarios in 2050.
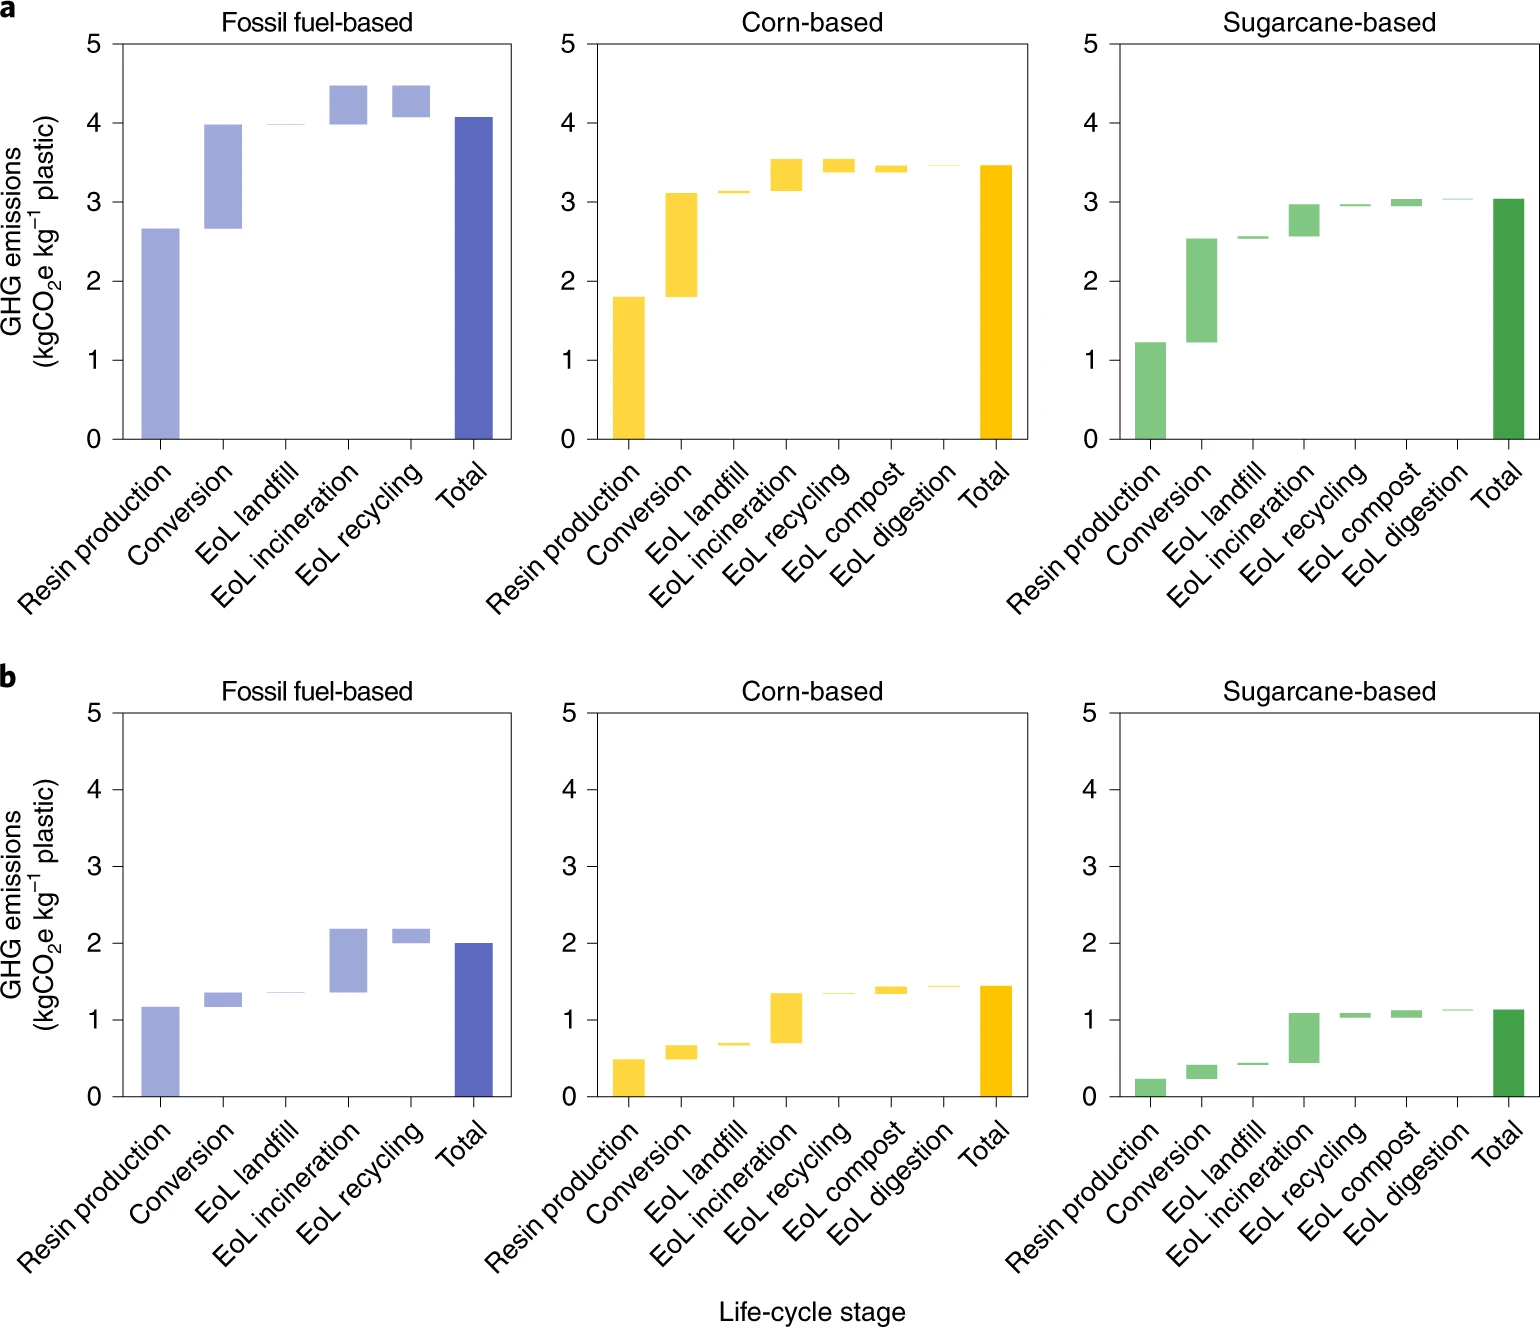
a, GHG emissions under the current energy-mix scenario in 2050. b, GHG emissions under a 100%-renewable-energy scenario in 2050. Emissions results are based on the scenario with a 4% yr–1 growth rate for plastics demand and the projected EoL-management mix (Supplementary Table 10). Carbon credits generated by recycling are considered.
Life cycle stages:
- Fossil fuel-based plastic: resin production, coversion, EoL landfill, EoL incineration, EoL recycling.
- Bio-based plastic: resin production, coversion, EoL landfill, EoL incineration, EoL recycling, EoL compost, EoL digestion.
Methods
- Three life-cycle stages:
- resin-production stage, which includes all activities from cradle to polymer-production factory gate;
- conversion stage, covering the manufacturing processes turning polymers into final plastic products;
- EoL stage, referring to treatment and disposal processes of plastic waste.
Mapping the Influence of Food Waste in Food Packaging Environmental Performance Assessments
Journal of Industrial Ecology
First published: 25 March 2018
Martin C. Heller $^1$, Susan E. M. Selke $^2$, Gregory A. Keoleian $^1$
$^1$ Center for Sustainable Systems, School of Natural Resources and Environment, University of Michigan, Ann Arbor, MI, USA
$^2$ School of Packaging and Center for Packaging Innovation and Sustainability, Michigan State University, East Lansing, MI, USA
Many Happy Returns: Combining insights from the environmental and behavioural sciences to understand what is required to make reusable packaging mainstream
Sustainable Production and Consumption
Sarah C.Greenwood
$^a$ Grantham Centre for Sustainable Futures, University of Sheffield, Sheffield S3 7RD
$^b$ Department of Chemistry, University of Sheffield, Sheffield S3 7HF
Environmental performance comparison of bioplastics and petrochemical plastics: A review of life cycle assessment (LCA) methodological decisions
Resources, Conservation and Recycling
Received 31 August 2020, Revised 14 December 2020, Accepted 24 January 2021, Available online 5 February 2021.
George Bishop $^a$, David Styles $^{a,b}$, Piet N.L.Lens $^b$
$^a$ Ryan Institute, National University of Ireland, University Road, Galway, H91 REW4, Ireland
$^b$ School of Engineering, University of Limerick, Limerick, V94 T9PX, Ireland
Don’t scrap the waste: The need for broader system boundaries in bioplastic food packaging life-cycle assessment – A critical review
Journal of Cleaner Production
Received 19 November 2019, Revised 12 May 2020, Accepted 11 June 2020, Available online 16 July 2020.
Sarah Kakadellis $^{a}, Zoe M.Harris $^{a,b}$
$^{a}$ Centre for Environmental Policy, Imperial College London, London, SW7 1NE, United Kingdom
$^{b}$ Centre for Environment and Sustainability, University of Surrey, Guildford, Surrey, GU2 7XH, United Kingdom
Growing environmental footprint of plastics driven by coal combustion
[Nature Sustainability(https://www.nature.com/articles/s41893-021-00807-2#Abs1)]
Published: 02 December 2021
Livia Cabernard $^{a,b}$, Stephan Pfister, Christopher Oberschelp & Stefanie Hellweg
$^{a}$ Swiss Federal Institute of Technology, ETH Zürich, Department of Civil, Environmental and Geomatic Engineering, Institute of Environmental Engineering, Ecological Systems Design, Zürich, Switzerland
$^{b}$ Swiss Federal Institute of Technology, ETH Zürich, Department of Humanities, Social and Political Sciences, Institute of Science, Technology and Policy (ISTP), Zürich, Switzerland
Acidification is where the pH level of soil decreases and reduces plant vigour. While soil acidification is a natural process (especially in higher rainfall regions), agricultural practices can greatly accelerate the rate of acidification. ↩︎
