Recycling rates in 27 top countries
Table of Contents
Malaysia
(Report) Market Study for Malaysia: Plastics Circularity Opportunities and Barriers
https://www.worldbank.org/en/country/malaysia/publication/market-study-for-malaysia-plastics-circularity-opportunities-and-barriers
Three Key Quantitative Findings on Collected For Recycling (CFR) Rates and Material Value Loss
Malaysia recycled about 24% of the key plastic resins in 2019.
In 2019, 1.41 million tonnes per year (TPY) of the four key resins assessed in this study (PET, HDPE, LDPE and PP) were consumed in Malaysia, out of which an estimated 334,000 TPY (24%) were recycled.
- the JPSPN (National Solid Waste Management Department) recycling target for 2025 is 40%.

Figure 1a. Estimated CFR rates for each resin 2019
PET packaging 37%
PET Polyester 3%
PP 30%
HDPE 27%
LDPE 27%
LDPE/LLDPE 10%
average 24%
the Malaysia Sustainable Plastics Alliance (MaSPA) in 2019:
- Identify and eliminate five problematic or unnecessary single-use plastic items through redesign, innovation or alternative (reuse) delivery models by 2025.
- 100% of plastic packaging to be recyclable/reusable/compostable by 2030
- 25% of post-consumer plastic packaging effectively recycled or composted by 2025.
- 15% of average recycled content to be achieved across all plastic packaging by 2030.
In Malaysia, much of the recycling happens separate from the SWM system via upstream diversion directly by the informal sector (e.g. waste pickers, collectors, junk shops and waste aggregators) leading to a parallel economy for recyclables collection.
This study categorizes the plastic resins into either packaging or non-packaging applications.
Table 1. BREAKDOWN OF PLASTICS END-USE INDUSTRIES IN MALAYSIA

(Journal) Malaysia Versus Waste
https://www.thechemicalengineer.com/features/malaysia-versus-waste/
First published in The Chemical Engineer, Jul/Aug 2020, issue 949/50
By Dr Eleni Iacovidou and Dr Kok Siew Ng
29 Jul 2020
MALAYSIA is on track to miss its 2020 targets to divert 40% of waste from landfill and increase recycling rates to 22%.
According to the Ministry of Housing and Local Government in Malaysia, around RM430m (US$100m) has been spent on closing just 17 out of 165 existing dumpsites, and promoting the disposal of solid waste to sanitary landfill.
According to the most recent stats available, almost 90% of waste was reportedly disposed to sanitary landfills, while only 10.5% was recycled.
(Journal) The plastic waste problem in Malaysia: management, recycling and disposal of local and global plastic waste
SN Applied Sciences
Published: 08 March 2021
Hui Ling Chen
School of Environmental and Geographical Sciences, University of Nottingham Malaysia, Semenyih, Malaysia
That being said, landfillis the favoured form of solid waste management in Malaysia, with 85 percent of material going to landfill; this high percentage stems from the low cost of this form of solid waste management.
(Journal) Sustainable Waste-to-Energy Development in Malaysia: Appraisal of Environmental, Financial, and Public Issues Related with Energy Recovery from Municipal Solid Waste
In Malaysia, 50% of landfills are open dumping sites; 30% use-controlled tipping; 12% are controlled landfills with daily cover; 5% are sanitary landfills without leachate treatment facility; and the other 5% are sanitary landfills with leachate treatment.
sanitary landfill:10, unsanitary landfill:40, open dump:50
Malaysia is eyeing waste-to-energy solutions
https://www.greendkinsea.com/post/malaysia-is-eyeing-waste-to-energy-solutions
Malaysia’s first WTE plant in Ladang Tanah Merah, Port Dickson, Negeri Sembilan, which was scheduled to be fully operational in June 2020 is now delayed due to nationwide movement restrictions amidst the global COVID-19 pandemic.
The Housing and Local Government Ministry of Malaysia aims at reducing solid waste disposed directly to landfills by promoting the 3R (Reduce, Reuse, Recycle) lifestyle and introducing new and proven technologies such as plans to set up six waste-to-energy (WtE) plants by 2025 with various technologies to be evaluated.
(Journal) Sanitary Landfill is a Solution in Solid Waste Management or a Silent Threat to Environment: Malaysian Scenario
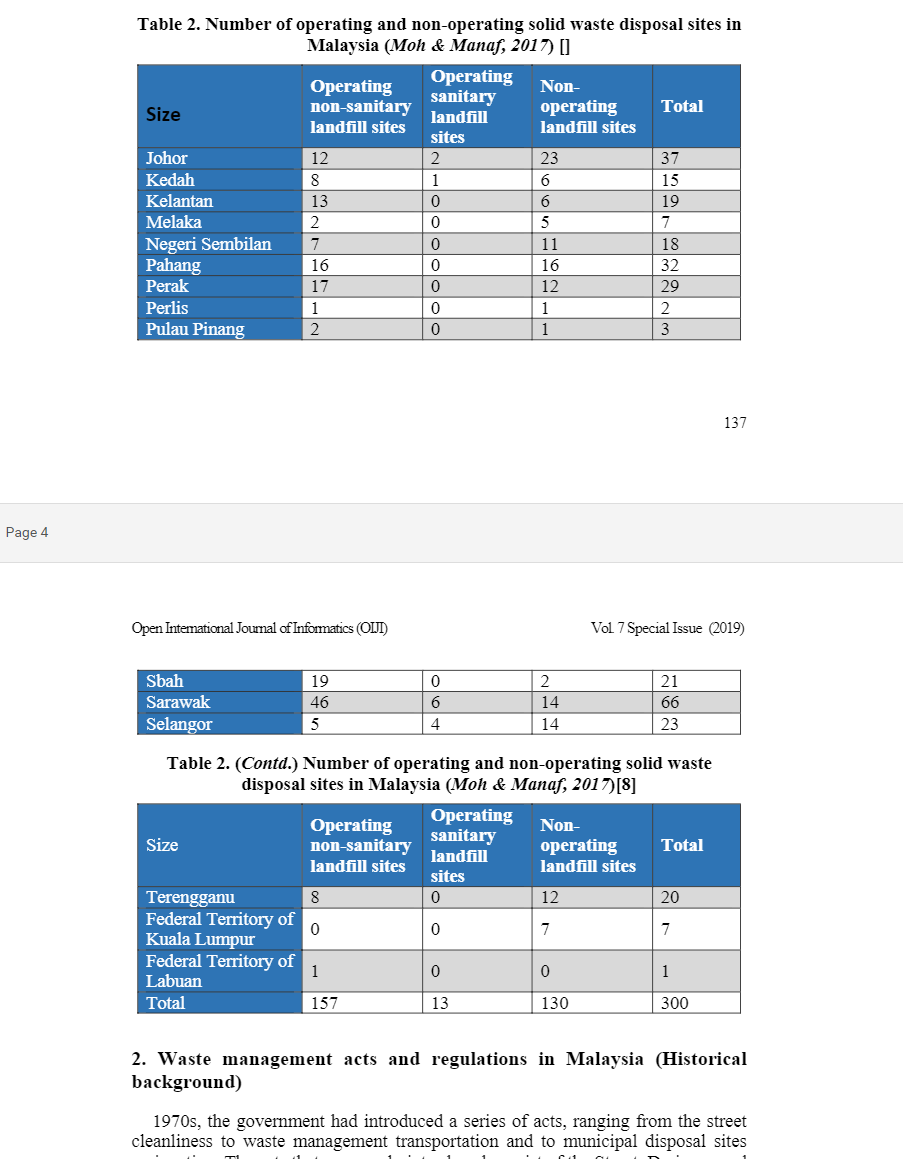
the non-sanitary landfill rate in Malaysia is 92.35 (based on site numbers)
(official website) Compendium of Environment Statistics, Malaysia 2020
Compendium of Environment Statistics, Malaysia 2021
recycle rate%
2018: 24.6
2019: 28.1
2020: 30.7
Indonesia
(News) On the Frontline of Indonesia’s Plastic Waste Crisis
https://www.wilsoncenter.org/event/frontline-indonesias-plastic-waste-crisis
Indonesia’s National Plastic Action Partnership estimates that only 10 percent of Indonesia’s yearly 6.8 million tons of plastic waste is recycled and nearly half is dumped or burned. Indonesia is responsible for 10 percent of global plastic leakage into the ocean, second only behind China.
(Report) National Plastic Waste Reduction Strategic Actions for Indonesia
https://www.unep.org/ietc/resources/policy-and-strategy/national-plastic-waste-reduction-strategic-actions-indonesia
June 2020
the Ministry of Environment and Forestry (MoEF), the Government of Indonesia, and the IGES Centre Collaborating with UNEP on Environmental Technologies (CCET), in collaboration with Sustainable Waste Indonesia (SWI).
MoEF - Ministry of Environment and Forestry
EPR - Extended Producer’s Responsibility
Fig. 3 and Table 2 show plastic waste reduction projection estimates by MoEF during the discussion on development of the EPR regulation.
The composition of plastic waste, the baseline recycling rate, and the annual increase in the recycling rate are estimated at 14%, 7% and 2% respectively.
(Report) Radically Reducing Plastic Pollution in Indonesia: A Multistakeholder Action Plan National Plastic Action Partnership
https://globalplasticaction.org/countries/indonesia/#:~:text=Released%20in%20April%202020%2C%20Radically,pollution%20by%202040%20through%20transitioning
April 2020
March 2019, Minister Luhut B. Pandjaitan, Indonesia’s Coordinating Minister of Maritime Affairs and Investment, joined forces with the Global Plastic Action Partnership to launch the Indonesia National Plastic Action Partnership (NPAP).
Around 6.8 million tonnes of plastics became plastic waste (MSW) in 2017.

Currently use one year instead.
Thailand
(report) Plastic Waste Material Flow Analysis for Thailand
the World Bank
data for 2018
recycled 21.4%
incineration 6%
sanitary landfill 46.6%
unsanitary landfill 15%
open dump 2.3
open burning 8.7
(report) Market Study for Thailand: PLASTICS CIRCULARITY OPPORTUNITIES AND BARRIERS
the World Bank
data for 2018
recycled 17.6% (follow-up structure is as same as above)
incineration 7.63%
sanitary landfill 46.6%
unsanitary landfill 15%
open dump 2.3
open burning 8.7
Currently use one year 2018 instead.
Viet Nam
Europe (without Turkey)
(report) The Circular Economy for Plastics – A European Overview (28/04/2022)
https://plasticseurope.org/knowledge-hub/the-circular-economy-for-plastics-a-european-overview-2/
EU27 + Norway, Switzerland and The United Kingdom
for the year 2020
(report) Plastics – the Facts 2020
https://plasticseurope.org/knowledge-hub/plastics-the-facts-2020/
EU27 + Norway, Switzerland and The United Kingdom
for the year 2018
USA
The Real Truth About the U.S. Plastics Recycling Rate

Canada
Environment and Climate Change Canada. (2019). Economic study of the Canadian plastic industry, markets and waste
Plastic Waste in Canada
Poor plastic waste management in Canada contributes to environmental pollution and economic inefficiencies. The country deposits 86 per cent of plastic waste in landfills, and incinerates another 4 per cent, while only 9 per cent is recycled (Environment and Climate Change Canada, 2019).
Currently use one year only instead.
Mexico
(News) In Mexico City, Veolia will build and operate one of the largest waste to energy facilities in the world and the first in Latin America
https://www.veolia.com/en/news/waste-to-energy-renewable-energy-mexico
The plant is scheduled to start in 2020
This plant will treat 1.6 million tonnes of household waste per year
(News) Recycling in Mexico, an industry with potential
https://www.plastico.com/es/noticias/recycling-mexico-industry-potential
In the “First Quantitative Study of the Plastics Recycling Industry in Mexico”, presented by Anipac last May, which means a recycling rate of 30% of the plastics consumed in the country.
2020
(report) Waste Management Country Report: Mexico
https://hollandcircularhotspot.nl/wp-content/uploads/2021/04/Report_Waste_Management_Mexico_20210322.pdf
70% ends up in landfills and the remaining 20% is disposed of in illegal dumpsites. (Mexican Institute for Statistics and Geography INEGI, 2018)
40% of the deposited waste ends up in 82 (bigger) landfills with basic infrastructure in place.
re: 30%
incineration: 0%
sani landfill: 21.78%
unsani landfill:32.66%
open dump: 15.56%
open burning: 0%
Turkey
(reprot) Plastic Pollution Policy Country Profile: Turkey
https://nicholasinstitute.duke.edu/sites/default/files/projects/Plastic-Pollution-Policy-Country-Profile-Turkey.pdf
2016
re: 6%
landfill: 61%
open dump:33%
(news) UK plastics sent for recycling in Turkey dumped and burned, Greenpeace finds
Hongkong (3 year)
(government report) Monitoring of Solid Waste in Hong Kong: Waste Statistics for 2020
Environmental Protection Department
December 2021
https://www.wastereduction.gov.hk/sites/default/files/msw2020.pdf
Among the various types of recyclables, plastic recyclables’ recovery rate increased from 8% in 2019 to 11% in 2020.
2019: Disposed of at landfills 4.04 million tonnes (71%) Recovered 1.64 million tonnes (29%)
2020: Disposed of at landfills 3.96 million tonnes (72%) Recovered 1.54 million tonnes (28%)
2019: re: 8% land: 92%
2020: re: 11% land: 89%
(government report) Monitoring of Solid Waste in Hong Kong: Waste Statistics for 2019
https://www.wastereduction.gov.hk/sites/default/files/msw2019.pdf
2018: re: 7% land: 93%
Taiwan
(official report) Solid Waste Statistics, Environmental Protection Administration
https://www.epa.gov.tw/eng/513B0B39D090DE4C
Table 4-1 Generation and Treatment of Municipal Waste
Amount of Municipal Waste Generated (Tonnes)/Incineration/Sanitary Landfill
2018: 9,740,671/4,103,398/87,251
2019: 9,812,418/4,042,110/86,402
2020: 9,869,675/3,789,352/106,703
2021: 10,049,062/3,501,983/247,114
Table 4-2 Composition of Municipal Solid Waste
Plastics
2018:17.79
2019:18.67
2020:20.20
2021:26.28
Table 4-3 Amount of Municipal Waste Recycled by Implementing Agencies
Plastic (Kg)
2018: 536,388,476
2019: 642,242,139
2020: 676,934,348
2021: 699,928,065
2018: re: 0.3095, in:0,6761, landfill: 0,0144
2019: re: 0.3506, in: 0,6358, landfill: 0,0136
2020: re: 0.3395, in: 0,6424, landfill: 0,0181
2021: re: 0.2650, in: 0,6866, landfill: 0,0484
India
(official report) Annual Report 2019-20 on Implementation of Plastic Waste Management Rules, 2016
https://cpcb.nic.in/status-of-implementation-of-plastic-waste/
Maharashtra 2019
total: 443724
RE: 273589 61.66%
RDF: 108700 24.50%
landfill: 5.29%
(waste for road construction and co-processing in cement industry is counted as mechanical recycling)
Plastic waste collection = 3,47,681 tonnes; Collection efficiency= 78% Plastic waste recycling and processing= 2,73,589 tonnes (62% of plastic waste generated) Out of this, following are main modes of use- Plastic waste used for Refuse Derived Fuel (RDF) = 1,08,700 tonnes Plastic waste sent for coprocessing= 15,857 tonnes Plastic waste used for granule making= 17,981 tonnes Plastic waste used for pyrolysis= 5,579 tonnes Plastic waste used for road construction= 5,515 tonnes Plastic waste sent to landfilling facility= 23,482 tonnes In compliance of order dated 04.12.2019 passed by Hon’ble NGT, in the matter of O.A.
the newest report exposed the data of 2019
South Korea
(journal) Recycling and management practices of plastic packaging waste towards a circular economy in South Korea
https://doi.org/10.1016/j.resconrec.2020.104798
27 March 2020
for the year 2017
re: 13.5
in: 37
land: 11
open buring: 38.5
Vietnam
(journal) Plastic Recycling Practices in Vietnam and Related Hazards for Health and the Environment
Int J Environ Res Public Health
2021 Apr 15
From the total volume of MSW collected, about 71% is treated by landfilling, 16% is processed in composting plants, and 13% is treated by incineration. Out of the larger landfills, receiving more than 20,000 t/day, only 30% are classified as sanitary landfills as landfills with daily cover. Only 9% of the landfills are equipped with weights and 36% with bottom lining. Most landfills do not have compactors, a gas collection system, leachate treatment, or environmental monitoring [18].
(report) Market Study for Vietnam : Plastics Circularity Opportunities and Barriers
https://www.worldbank.org/en/country/vietnam/publication/market-study-for-vietnam-plastics-circularity-opportunities-and-barriers
Vietnam recycled about 33% of key plastics resins in 2019.
re: 33
in: 10.37
sani landfill: 17.00
unsani landfill: 39.63
Japan
(report) An Introduction to Plastic Recycling 2019
https://www.pwmi.or.jp/ei/plastic_recycling_2019.pdf
Japan’s Plastic Waste Management Institute
data: July 2019
2018
re: 0.27
in: 0.56
landfill: 0.08
open burning: 0.08
Philippines
(report) Philippines: Plastics Circularity Opportunities Report
https://www.worldbank.org/en/country/philippines/publication/market-study-for-philippines-plastics-circularity-opportunities-and-barriers-report-landing-page#:~:text=ThThe%20Philippines%20recycled%20just,than%20recycled%20into%20valuable%20materials.
The Philippines recycled just 28% of key plastic resins in 2019.
(report) BACKGROUND - WWF-Philippines
https://wwf.org.ph/wp-content/uploads/2020/10/WWF_A4_Factsheet_PHILIPPINES.pdf
for the year 2019
re: 0.1139
in: 0.0253
landfill: 0.4177
open: 0.4430
With the fixed re from the World Bank and the structure from WWF for the year 2019:
re: 0.28
in: 0.0206
landfill: 0.3394
open: 0.3600
Australia
(report) APCO Collective Impact Report
https://documents.packagingcovenant.org.au/public-documents/APCO%20Collective%20Impact%20Report
Australian Packaging Covenant Organisation (Apco)
plastic packaging recovery rate 16% for plastic 2019-2020, 18% for 2018-2019.
(official report) National Waste Report 2020
https://www.dcceew.gov.au/environment/protection/waste/national-waste-reports/2020
2018
re: 0.13
in: 0.028
landfill: 0.842
(official report) Australian Plastic Flows and Fates Study 2019-20 National Report
https://www.dcceew.gov.au/environment/protection/waste/publications/australian-plastic-flows-and-fates-report
Date: 2021
2019
re: 0.124
in: 0.007
landfill: 0.869
