(Collection) Plastic waste treatments and related LCA
Table of Contents
Recycling methods
Achieving net-zero greenhouse gas emission plastics by a circular carbon economy
Science
30 Sep 2021
Raoul Meys
Institute for Technical Thermodynamics, RWTH Aachen University, Schinkelstr. 8, 52062 Aachen, Germany.
Scenarios
Using this model, we project five pathways for life-cycle GHG emissions of plastic from “cradle-to-grave” in the year 2050.
- The recycling pathway allows maximal recycling of all plastic wastes, on the basis of a 6% minimal landfilling rate projected by Geyer et al.
- Biomass and CCU pathways assume that plastic waste is primarily incinerated.
The resulting CO2 emissions are circulated via biomass uptake or CCU. - The circular carbon pathway optimally combines recycling, biomass utilization, and CCU.
- The GHG emissions of all circular pathways are benchmarked to state-of-the-art plastic production and waste incineration, framed as the linear carbon pathway.
End-of-life technologies
Three options exist to treat plastic waste: landfilling, incineration (e.g., energy recovery), and recycling. Several intermediate waste fractions occur during these three waste treatment options: sorted fractions, residues from sorting, and residues from mechanical and chemical recycling (Fig.
S2).
Landfilling and incineration are included for all plastic wastes and intermediate waste fractions. In case of mechanical recycling, current practice from European countries like Germany and Austria shows that plastic packaging waste can be efficiently recycled. In contrast, other plastic wastes suffer significant difficulties due to impurities inside the waste and cannot be adequately recycled mechanically (39). Thus, our analysis only considers mechanical recycling for sorted fractions of plastic packaging waste.
In addition to mechanical recycling, chemical recycling is highlighted as one of the most promising technologies to combat the plastic crisis and, at the same time, reduce greenhouse gas emissions of chemical and plastic production. While chemical recycling is not limited to the plastic waste input, its outputs range from refinery feedstock over liquid and gaseous fuels to monomer products and even value-added chemicals. Previous studies showed that chemical recycling is most promising if value-added chemicals, like monomers, are produced (42, 78). However, these technologies are still under development. Thus, this publication includes the pyrolysis of plastic wastes to steam-cracking feedstock, e.g., naphtha, and the production of the respective chemical monomers from chemical recycling as early-stage technologies. Chemical recycling is assumed to be able to treat every plastic waste and all intermediate waste fractions.
CCU pathway
The CCU pathway establishes carbon loops via the incineration of plastic and the respective re-utilization of CO2. The following high-TRL technologies are available: methanol and methane from CO2, direct air capture, and electrified steam production. Via methanol-to-olefins or methanol-to-aromatics, all plastic raw materials can be produced. The following low-TRL technologies are available: benzene, toluene, p-xylene, mixed xylenes, carbon monoxide, ethylene oxide, ethylene, propylene, and styrene from CO2, as well as the ohmic heating to provide high-temperature thermal energy.
Recycling burdens and benefit allocation
Cradle-to-grave life cycle assessment of single-use cups made from PLA, PP and PET
Resources, Conservation and Recycling
Christian Moretti
Utrecht University, Copernicus Institute of Sustainable Development, Utrecht, the Netherlands
- PET production out of PTA and ethylene gylcol(Purified Terephthalic Acid) (esterification1 and polymerisation)-> Amorphous PET-> PET cups
- Propylene (polymerisation) -> PP
- Polylactide (PLA) is both bio‐based and biodegradable
Life cycle energy and GHG emissions of PET recycling: change-oriented effect
Li Shen
The International Journal of Life Cycle Assessment
Life cycle environmental impacts of chemical recycling via pyrolysis of mixed plastic waste in comparison with mechanical recycling and energy recovery
Science of The Total Environment
Received 4 November 2020, Available online 5 January 2021.
Harish Jeswani et al.
Department of Chemical Engineering and Analytical Science, The University of Manchester, Sackville Street, M13 9PL, UK
Abstract
- This study uses life cycle assessment (LCA) to compare the environmental impacts of chemical recycling of mixed plastic waste (MPW) via pyrolysis with the established waste management alternatives: mechanical recycling and energy recovery.
- Three LCA studies have been carried out under three perspectives: waste, product and a combination of the two.
- To ensure robust comparisons, the impacts have been estimated using two impact assessment methods: Environmental footprint and ReCiPe.
- The results suggest that chemical recycling via pyrolysis has a 50% lower climate change impact and life cycle energy use than the energy recovery option. The climate change impact and energy use of pyrolysis and mechanical recycling of MPW are similar if the quality of the recyclate is taken into account.
- Furthermore, MPW recycled by pyrolysis has a significantly lower climate change impact (−0.45 vs 1.89 t CO2 eq./t plastic) than the equivalent made from virgin fossil resources.
- However, pyrolysis has significantly higher other impacts than mechanical recycling, energy recovery and production of virgin plastics.
- Sensitivity analyses show that some assumptions have notable effects on the results, including the assumed geographical region and its energy mix, carbon conversion efficiency of pyrolysis and recyclate quality.
Methods, results, and discussions
- Waste perspective
- The functional unit is defined as the treatment of 1 t of MPW (mixed plastic waste).
- Scope: collection and transportation of MPW from households, sorting and pyrolysis of MPW to produce pyrolysis oil, as the main product and char as a co-product.
- System boundaries:

- In Germany, 30% of MPW is incinerated with MSW and 70% is used to produce RDF and recover energy (UBA, 2018).
Results:
- chemical recycling, incin.30% and RDF 70%, inclination 100%, and RDF 100%
- climate change:
The credits are related to the avoided production of naphtha displaced by the pyrolysis oil, which reduces the total impact by 423 kg CO2 eq./t. - Sensitivity analysis:
- Electricity mix for energy credits (in the case of energy recovery).
All energy is sourced from fossil fuels; and all energy is provided by renewable sources.2 - Economic value of mixed plastic waste (Chemical recycling and energy recovery).
Affecting the economic allocation in the sorting plant between single and mixed plastic waste. - Composition of mixed plastic waste (Chemical recycling and energy recovery)
- Quality of purified pyrolysis oil (Chemical recycling)
- Carbon conversion efficiency of pyrolysis (Chemical recycling)
- The quality of recyclate (Mechanical recycling)
- Material efficiency of mechanical recycling
- Parameters in the circular footprint formula (Chemical recycling, mechanical recycling and energy recovery)
- Electricity mix for energy credits (in the case of energy recovery).
- Product perspective
- The functional unit: the production of 1 t of plastic granulate of virgin-grade quality.
- Scope: collection and transportation of MPW to a sorting plant, sorting, pyrolysis, purification of pyrolysis oil and production of LDPE.
- System boundaries:

- system expansion: accounting for the avoided impacts from incineration, RDF, and the loss of recovered energy, compared with the production of virgin LDPE produced from naphtha.
- Combined product and waste perspective
- the functional unit is defined as the production of 1 t of mixed virgin plastics and their end-of-life treatment.

Mechanical recycling and CFF parameters
The recycling process consists of two main steps: pre-treatment of plastic waste(sorting, grinding, washing and drying) and production of recycled plastic granulate(separation of materials, removal of contaminants, additional sorting, extruding and pelletising).
Table 4. Inventory data for mechanical recycling.
The circular footprint formula (CCF), the EU methodology to credit for circular strategies
Slides for explanation by Sphera Solutions GmbH
The circular footprint formula (CCF), the EU methodology to credit for circular strategies
Suggestions for updating the Product Environmental Footprint (PEF) method
Original technical reports by Joint Research Centre of EC, Luca Zampori, 2019
4.4.8.1 The Circular Footprint Formula (CFF)

Parameters of the CFF
A: allocation factor of burdens and credits between supplier and user of recycled materials.
B: allocation factor of energy recovery processes. It applies both to burdens and credits.
Qsin: quality of the ingoing secondary material, i.e. the quality of the recycled material at the point of substitution.
Qsout: quality of the outgoing secondary material, i.e. the quality of the recyclable material at the point of substitution.
Qp: quality of the primary material, i.e. quality of the virgin material.
R1: it is the proportion of material in the input to the production that has been recycled from a previous system.
R2: it is the proportion of the material in the product that will be recycled (or reused) in a subsequent system. R2 shall therefore take into account the inefficiencies in the collection and recycling (or reuse) processes. R2 shall be measured at the output of the recycling plant.
R3: it is the proportion of the material in the product that is used for energy recovery at EoL.
Erecycled (Erec): specific emissions and resources consumed (per functional unit) arising from the recycling process of the recycled (reused) material, including collection, sorting and transportation process.
ErecyclingEoL (ErecEoL): specific emissions and resources consumed (per functional unit) arising from the recycling process at EoL, including collection, sorting and transportation process.
Ev: specific emissions and resources consumed (per functional unit) arising from the acquisition and pre-processing of virgin material.
E*v: specific emissions and resources consumed (per functional unit) arising from the acquisition and pre-processing of virgin material assumed to be substituted by recyclable materials.
EER: specific emissions and resources consumed (per functional unit) arising from the energy recovery process (e.g. incineration with energy recovery, landfill with energy recovery, etc.).
ESE, heat and ESE, elec: specific emissions and resources consumed (per functional unit) that would have arisen from the specific substituted energy source, heat and electricity respectively.
ED: specific emissions and resources consumed (per functional unit) arising from disposal of waste material at the EoL of the analysed product, without energy recovery.
XER, heat and XER, elec: the efficiency of the energy recovery process for both heat and electricity.
LHV: lower heating value of the material in the product that is used for energy recovery.
4.4.8.2 The A factor
The A factor allocates burdens and credits from recycling and virgin material production between two life cycles (i.e. the one supplying and the one using recycled material) and it aims to reflect market realities.
An A factor equal to 1 would reflect a 100:0 approach (i.e. credits are given to the recycled content), an A factor equal to 0 would reflect a 0:100 approach (i.e. credits are given to the recyclable materials at the end of life).
In PEF studies the A factor values shall be in the range 0.2 ≤ A ≤ 0.8, to always capture both aspects of recycling (recycled content and recyclability at end of life).
The driver to determine the values of the A factor is the analysis of the market situation. This means:
- A=0.2. Low offer of recyclable materials and high demand: the formula focuses on recyclability at end of life.
- A=0.8. High offer of recyclable materials and low demand: the formula focuses on recycled content.
- A=0.5. Equilibrium between offer and demand: the formula focuses both on recyclability at end of life and recycled content.
Default application-specific and material-specific A values are available in Annex C. The following procedure shall be applied (in hierarchical order) to select the value of A to be used in a PEF study:
- Check in Annex C the availability of an application-specific A value which fits the PEF study,
- If an application-specific A value is not available, the material-specific A value in Annex C shall be used,
- If a material-specific A value is not available, the A value shall be set equal to 0.5.
4.4.8.3 The B factor
The B factor is used as an allocation factor of energy recovery processes. It applies both to burdens and credits. Credits refer to the amount of heat and electricity sold, not to the total produced, taking into account relevant variations over a 12-months period, e.g. for heat.
In PEF studies the B value shall be equal to 0 as default.
To avoid double-counting between the current and the subsequent system in case of energy recovery, the subsequent system shall model its own energy use as primary energy.
European Database for Corrugated Board Life Cycle Studies
Closed-loop approach
To analyse an open-loop system, the inputs and outputs from the linked systems have to be studied.Calculation for one tonne of corrugated product
The closed-loop system assumes the ideal case that no recovered fibres are lost from the production shavings and the collected corrugated board after use, and that the fibre quality remains constant due to the reprocessing of the fibres. The primary fibre is thus recycled several times within the system.
Modeling recycling in life cycle assessment
Final project report
Project period: 2018-11-15 – 2020-05-31
IVL Swedish Environmental Research Institute
- aiming to analyze and discuss how open-loop recycling of materials should be modeled in LCA and similar environmental assessments.
the system investigated in a CLCA is expanded beyond the product life cycle when it accounts for the avoided processes
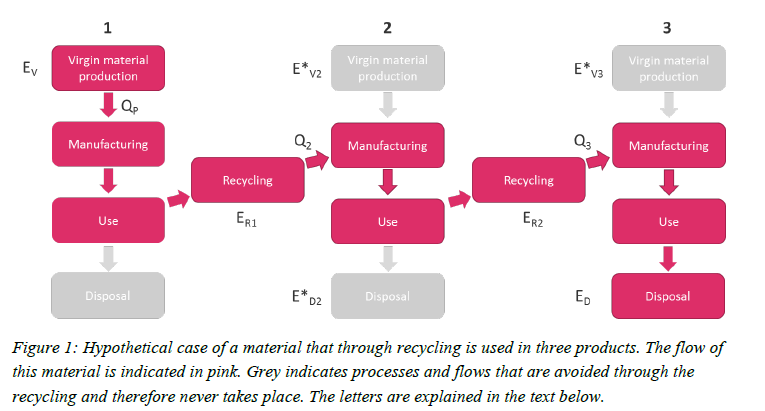
In Figure 1, all of the material in Product 1 is recycled into Product 2, which does not include any other material. Similarly, all of the material in Product 2 is recycled into Product 3, which does not include any other material. However, no part of Product 3 is recycled after use.
EV = EV2 = EV3 = 12
ER1 = ER2 = 4
ED1 = ED2 = ED = 6
ETot = EV + ER1 + ER2 + ED
QP = 1
Q2 = 0.75 (if not otherwise stated)
Q3 = 0.5 (if not otherwise stated)
• EV is the environmental burdens of virgin material production,
• ER is the environmental burdens of the recycling process,
• ED is the environmental burdens of the waste disposal,
• the asterisk indicates that the process is avoided through recycling,
• ETot is the total burdens of virgin material production, recycling and disposal in the recycling cascade,
• QP is the quality of the material delivered by the primary production,
• Q2 is the quality of the material delivered by the first recycling process, and
• Q3 is the quality of the material delivered by the second recycling process.
1. Simple cut-off
E = (1 – R1) × EV + R1 × ER + (1 – R2) × ED (Recycled content approach 100/0 method)
• R1 is the share of recycled material in the product,
• R2 is the rate of recycling of material after use in the product, and
• ER is the environmental burdens of the recycling activities that supply recycled material to the product.
a drawback of the simple cut-off is that it does not give incentives for recycling after use, when the final disposal has little or positive net environmental burdens.
The Greenhouse Gas (GHG) Protocol of the World Resources Institute (WRI) and the World Business Council for Sustainable Development (WBCSD) recommends the method when (WRI & WBCSD 2011, p.74):
- the product investigated contains recycled input, but there is no or an unknown amount of recycling after use,
- the supply of recyclable material exceeds the demand for recycled material, or
- the company doing the LCA has control over how much recycled material to use.
2. Cut-off with economic allocation
E = (1 – R1) × EV + β × R1 × ERin + (1 – R2) × ED + α × R2 × ERout
• ERin is the environmental burdens of the recycling process supplying recycled material to the product and
• ERout is the environmental burdens of the recycling process accepting materials from the product.
3. Cut-off plus credit
4. Allocation to material losses
- The international standard for LCA, ISO 14044, states that a closed-loop approach applies when a material is recycled into the same product system, or when it is recycled into another product system without changes in the properties of the material (ISO 2006).
In the technical report ISO TR 14049, ISO (2012, pp.30-33) proposes the following interpretation of the closed-loop approach:
E = (1 – R2) × EV + R2 × ER + (1 – R2) × ED
- This interpretation of closed loop means that the environmental burdens of virgin material production and final disposal are attributed to the product life cycle where the material is not recycled.
PAS 2050 and the GHG Protocol both call the attributional interpretation of allocation to material losses the closed-loop approximation. Like ISO (2006, 2012), PAS 2050 recommends the method for cases where the recycled material maintains the same inherent properties as the virgin material input (BSI 2011, p.31). The GHG Protocol recommends the method in cases when (WRI & WBCSD 2011, p.74):
- the recycled content in the product is unknown, because recycled and virgin material cannot be distinguished on the market,
- the demand for recycled material exceeds the supply of recyclable material, or
- the product service life is short and/or well known.
In many of these cases, the GHG Protocol recommends the use of two methods in parallel to assess the robustness of the results: the closed-loop approximation (allocation to material losses) and the recycled-content approach (simple cut-off; see above).
5. Allocation to virgin material use
6. 50/50 methods
E = 0.5 × [(1 – R1) + (1 – R2)] × (EV + ED) + 0.5 × (R1 × ERin + R2 × ERout)
All 50/50 methods reflect the view that 1) material use requires both virgin material production and final disposal, and 2) supply of and demand for recyclable material are both necessary for recycling to take place.
7. Quality-adjusted 50/50 methods
8. The Circular Footprint Formula
E = (1 – R1) × EV + R1 × [A × ERin + (1 – A) × EV × QSin/QP] + + (1 – A) × R2 × [(ERout –EV × (QSout/QP)] + (1 – R2) × ED = = [1 – R1 + R1 × (1–A) × QSin/QP] × EV – (1 – A) × R2 × (QSout/QP) × EV + + AR1 × ERin + (1 – A) × R2 × ERout + (1-R2) × ED
With the low Factor A = 0.2 recommended for many materials, the CFF gives a rather weak incentive to use recycled material with a quality similar to virgin material. In other words, it gives a weak incentive to use most recycled metals.
waste treatment methods
Plastic recycling in a circular economy: determining environmental performance through an LCA matrix model approach
Waste Management
A.E.Schwarz
Netherlands Organization for Applied Scientific Research (TNO), Princetonlaan 8, 3584 CB Utrecht, the Netherlands
Available online 4 January 2021
Introduction
- Still, only 9% of the plastics ever produced have been recycled. The other fractions of waste plastic are either incinerated (12%), landfilled or lost to the environment (79%) (Geyer et al., 2017).
- Plastic packaging from municipal waste is most recycled, whereas plastic recycling from other sectors (Construction, electronics, automotive) lags behind (Consultic, 2012).
- The recycling outputs are credited as ‘avoided impact’ (materials, feedstock or energy).
Methodology
- Environmental data on materials, fuels and emissions was obtained from the ecoinvent 3.4 cut-off by classification database.
- SimaPro 8
- applying the midpoint impact categories from ReCiPe 2008 (h)
- the total impact was calculated to a single score by applying shadow prices on the ReCiPe characterized results. The shadow price set used is developed by CE Delft and TNO and gives the most recent economic damage per impact category (De Bruyn et al., 2010, Ligthart and van Harmelen, 2019).
2.3. Recycling technologies
- The level of development of the recycling technologies is defined on the Technology Readiness Level (TRL) scale (Mankins, 1995). Three levels: low (1–4), medium (5–7), and high (8–9).
- Primary recycling or closed-loop recycling (TRL: high).
Recycled products have the same properties as the previous product.
- mechanical recycling for pure plastics (TRL: high, not mixed with others).
- Dissolution of polymers with two solvents (TRL: low).
- Secondary recycling or open-loop recycling.
Recyclate is of lower quality than the original material.
- Open-loop mechanical recycling (TRL: high). Collected in mixed waste streams
and contains a significant amount of contamination.
- Tertiary recycling includes plastic to feedstock and plastic to monomer recycling3.
- (1) Gasification to feedstock products (TRL: high)4.
- (2) Pyrolysis to feedstock products (TRL: high)5.
- (3) Pyrolysis to wax products (TRL: high)6.
- (4) Thermochemical recycling to monomers through gasification (TRL: medium)7.
- (5) Thermochemical recycling to monomers through pyrolysis (TRL: medium)8.
- (6) Depolymerization through glycolysis (醣酵解) (TRL: medium)9.
- (7) Hydrolysis with water for specific biopolymers (TRL: low)10.
- Quaternary recycling or incineration of plastic material with energy recovery11.

- The system boundaries for the LCA matrix model include: polymer granulate production, recycling treatment impacts and avoided products.
- Outside the system boundaries are all parameters that vary greatly depending on product type, sector, and waste collection method. Polymer processing steps to products (e.g. injection moulding), the addition of additive materials, and waste collection and pre-treatment (sorting, cleaning) are not included.

Potential trade-offs between eliminating plastics and mitigating climate change: An LCA perspective on Polyethylene Terephthalate (PET) bottles in Cornwall
Science of The Total Environment
V.Kouloumpis
Environment and Sustainability Institute, University of Exeter, Penryn, Cornwall TR10 9FE, UK
College of Engineering, Mathematics and Physical Sciences, University of Exeter, Cornwall TR10 9FE, UK
Available online 13 April 2020
Methods
- The household waste can be categorised into two main types: recyclables and residual.
- Residual waste is collected weekly at the kerbside and transported to the Cornwall Energy Recovery Centre (CERC), the only waste-to-energy facility in Cornwall that started operation in 2017 (Cornwall Council, 2018a).
- Recyclables are separated by the residents and placed in four different containers. The recyclables are collected every fortnight at the kerbside and transported to one of the two Material Recovery Facilities (MRF) situated in the towns of Bodmin and Pool.
- At the MRFs, the plastic bottles (including the PET bottles) are consolidated, and transported by lorry out of the county to one of the three reprocessing facilities.
- 2017–18 total household waste ->
two parts: residual waste and waste intended for recycling ->
percentage of plastic bottles in every part ->
percentage of plastic bottles made of PET
(same way for glass bottles) - Functional unit: the liquids packaging service provided by 2468 t of PET bottles to households in Cornwall.
- the users can specify the glass/PET mass ratio for the bottling of the same quantity of liquid content.

- For the production of PET bottles, the raw material is assumed to be 35% of recycled bottle grade PET granulates and 65% of virgin PET granulates (Shen et al., 2011).
2.3. Life Cycle Inventory
2.3.1. Production
- polyethylene terephthalate production, granulate, amorphous
Technology: PET production out of PTA (purified terephthalic acid) and ethylene glycol. - polyethylene terephthalate production, granulate, bottle grade, recycled (CH)
- Processes deliver the byproduct waste polethylene, unsorted, for recycling12. There are two recycled PET grades produced in Switzerland13.
- Stretch blow molding14.
2.3.3. End-of-life
The ‘net scrap’ avoided burden approach
For the PET bottles, the avoided virgin PET production would be the percentage that is sent for recycling (53%) minus the losses during the recycling processes (25% × 53% = 13% of the initial PET bottles) and the percentage of the recycled content that was used for the production of the initial PET bottles (35%), equal to 5% of the initial PET bottles.
avoided burden of plastics = recyclables - losses - recyclables contained in the products
ecoinvent life cycle inventory
polyethylene terephthalate (ecoinvent 3.6)
Activity: polyethylene terephthalate production, granulate, bottle grade
Product: polyethylene terephthalate, granulate, bottle grade
Location: RER
Description: The first step of PET production is the esterification of PTA and MEG to bishydroxyethyl terepthalate (BHET) with water as a by-product at around 220-260 °C in the presence of an anti-mony catalyst (usually Sb2O3). Water forming from the esterification reaction is continuously removed by distillation. Formation of the undesired side product diethylene glycol is suppressed by maintaining low molar ratios of MEG:PTA (less than 2 or even 1.5). BHET is then sent to Pre-polycondensation in a second reactor under a vacuum and further to a melt polycondensation reactor at higher temperatures and still under vacuum. Vacuum is required to remove water and other side products and to drive the reaction equilibrium towards the polymer.
As melt polymerisation does not produce high molecular weight, a subsequent polymerisation step, solid state polymerisation (SSP) is required for bottle grade PET. During SSP the polymer chain lengths are increased by heat in the absence of oxygen and water, by means of either vacuum or purging with an inert gas to drive off the by-products of reactions. The reaction is driven by temperature, pressure, and the diffusion of by-products from the interior of the pellet to the surface. The product of SSP is a partially crystalline resin that can be used to produce bottles via injection moulding and stretch blow moulding.
The dataset represents the production mix of commercial bottle grade PET production technologies. PET production covered by this study is by esterification of ethylene glycol and terephthalic acid (PTA). The esterification process is carried out under moderate pressure (2.5-5.5 bar) and at high temperature (230-270 °C) whilst the water formed during the reaction is continuously removed via distillation.
The monomers of PET production, purified terephthalic acid (PTA) and mono ethylene glycol (MEG) are polymerised in the liquid phase to produce amorphous PET. This form of the polymer is suitable for the production of fibres and film. Most bottle grade PET today is a copolyester slightly modified through addition of 1-2% Benzene-1,3-dicarboxylic acid (isophthalic acid, IPA) or 4(hydroxymethyl)cyclohexyl-methanol (cyclohexanedimethanol, CHDM) during polymerisation.
Geography: EU27 including Norway and Switzerland
Technology: Coverage of production capacity in Europe: 85%
Time period: Data was collected for the year 2015, processed in 2016 and published in 2017
Activity: polyethylene terephthalate production, granulate, amorphous
Product: polyethylene terephthalate, granulate, amorphous
Location: RER
Description:
Data are based on the average unit process from the Eco-profiles of the European plastics industry
Geography: Data from several European production sites
Technology: PET production out of PTA and ethylene gylcol
Time period: date of publication
Waste Management
Open Dumping
Illinois Environmental Protection Agency
An open dump is an illegal waste disposal site and should not be confused with a permitted municipal solid waste landfill or a recycling facility
Any of the following seven conditions at a dump site can result in the issuance of an Administrative Citation:
- Litter
- Scavenging
- Open burning
- Placement of waste in standing or flowing water
- Promoting an increase of disease-carrying organisms
- Standing or flowing liquid discharge from the dump site
- Deposition of construction or demolition debris
The Open Dump Dilemma: How to Help the Environment and Respect Human Rights
1 March 2020
Women in Informal Employment: Globalizing and Organizing (WIEGO)
https://www.wiego.org/blog/open-dump-dilemma-how-help-environment-and-respect-human-rights
Open dumps, unlike sanitary landfills, are not engineered to protect the environment and human health…these sites are important sources of economic survival for expert recyclers – the world’s waste pickers – who earn a daily living there and feed our waste into the global recycling chain.
- Open dumps are the most prevalent form of waste disposal in the Global South.
Inventory parameters for regionalised mixes of municipal waste disposal in ecoinvent v3.5 (2018)
Technical report Zurich, December 2018
Gabor Doka
Doka Life Cycle Assessments, Zurich
ecoinvent Association, Zurich
https://www.doka.ch/WasteDisposalMixDoka2018.pdf
Highlights
- New activities are open burning, open dumping and unsanitary landfill.
- Five different climate classes are created based on annual water infiltration
- The devised methodology allows to create additional market mixes for other countries in the future as well as inputs of updated statistical data.
Employed disposal activities in the model encompass a selection of unmanaged activities (open burning, open dumping), and activities managed to different degrees (unsanitary landfill, sanitary landfill, municipal incineration).
we decided to create five different climate classes based on annual water infiltration to discern the different local conditions, instead of inventorying the activities of each country with their specific climate.
From the present project, ecoinvent inventories for market mixes for 37 European countries are created, plus five focus countries of the Sustainable Recycling Initiative SRI (Brazil, Colombia, Peru, India, South Africa).
Swiss disposal technologies in 1992:
- municipal incineration with elaborate flue gas cleaning
- well-engineered sanitary landfills with landfill gas capture15 and leachate treatment
- well buffered residual material landfills for polluted inorganic waste
1. Municipal waste disposal technology mix
(d). Open dump (unmanaged)
Uncollected waste or collected waste with unmanaged disposals.
(b). Open burning (unmanaged)
Uncollected waste or collected waste with unmanaged disposals.
(u). Unsanitary landfill (minimal management)
Waste is compacted and a daily cover is applied. This mitigates the direct unhygienic effects of dumps, but emissions to air or water remain unmitigated. The waste compaction and a daily waste cover leads to lower methane oxidation compared to open dumps and therefore larger methane emissions, which is modelled in the unsanitary landfill model.
(s). Sanitary landfill (managed plant)
sanitary landfills capture some landfill gas and treat the leachate. In LCA results the flaring or utilization of landfill gas is the most relevant difference compared to unsanitary landfills. Where information is available on landfill gas utilisation, it can be incorporated into the technology mix.
(m). Municipal incineration (managed plant)
Municipal incineration plants are costly investments and are currently only observed in countries with a Gross National Income (GNI) above 10'000 $/capita.yr. In countries below that threshold incineration can very likely be excluded.
The criteria to assign waste disposal technology over countries:
- Collection, management of collected waste
- occurrence of fires in dumps/landfills
- Gross National Income (GNI) above or below 10'000 $/capita.yr

1.1 Collected waste
Collected% - percentage of generated waste being collected, in mass percent of generated waste.
Source:
- percentage of the population being served by waste collection (UN
statistics, 74 countries, 1990-2017) - Based on Gross National Income per capita (GNI)


1.2 Uncontrolled vs. controlled disposal
Some part of the collected waste can be assumed to end up in uncontrolled, unmanaged disposals.
For large collection rates, the fraction of collected waste going to managed, controlled disposals is large.

the part of the generated waste going into unmanaged, uncontrolled
disposals:
1.3 Open burning


1.4 Open dumping

1.5 Unsanitary landfills
The mass landfilled in an unsanitary landfill will be further modified by subtracting an estimated amount of waste being burnt off in landfill fires.
1.6 Landfill Fires

1.7 Sanitary landfills
In the sanitary landfill inventory model, landfill gas can be captured and flared or utilized and the leachate is captured and treated.
Country-wise information on the quantitative extent of landfill gas capture is difficult to obtain.
1.8 Municipal incineration
- masses into waste incineration plants is available from Eurostat and OECD data
- The statistical data shows that in most countries practically 100% of incinerators also perform energy recovery.
2. Data reduction: Infiltration classes
In the model, scarcity of available precipitation water can influence the amount of landfill gases. The rate of water infiltrating the landfill body determines the speed of weathering of the landfill and influences inventoried emissions from the landfill body.
Each country or region can be assigned to a class of five infiltration rates. Infiltration in the landfill model is annual precipitation minus annual
actual evapotranspiration.


3. Municipal waste treatment markets
3.1 Treatment technology mix

3.2 Waste treatment production volumes

3.2.1 Discerned waste materials
Tab. 5.2 List of generic waste materials in mixed munici![]()pal waste used to generate new disposal activities in ecoinvent v3.5.- graphical paper; packaging paper; paperboard
- plastic, mixture; polyethylene (PE); polyethylene terephtalate (PET); polypropylene (PP); polystyrene(PS); polyurethane(PU, 聚亚安酯); polyvinylchloride (PVC, 聚氯乙烯)
- glass
- wood, untreated
3.2.2 Country-specific mass of disposed mixed municipal waste
Generated mass
per-capita waste generation mMSW and a country’s population by simple multiplication
- OECD data
- From data for 45 OECD countries the entries for ‘Recycling’, ‘Composting’ and ‘Other recovery’ were added and then divided by the ‘Municipal waste generated’ figure to obtain a recycling rate.
- Eurostat data
- From data for 40 European countries (including non-EU) the entries for ‘Material recycling’ and ‘Composting and digestion’ were added and then divided by the ‘Waste generated’ figure to obtain a recycling rate.
With data on the generated waste and the recycling rate it is now possible to calculate the non-recycled disposed waste mass as mD = mMSW ⋅ (1 – r).
The generated waste mass mMSW and disposed, non-recycled waste mass
mD.
3.2.3 Country-specific composition of disposed mixed municipal waste
Waste fraction analysis for around 100 countries is available from UN statistics (UNSD 2016b), which is based on UN questionnaires, EU or OECD statistics with the majority of data originating in the period 2000-2013. This UN data however only discerns the following waste fractions: “Paper, paperboard”, “Organic material”, “Plastics”, “Glass”, “Metals”, “Textiles”, “Other inorganic material”.

Subdividing Plastics
The UN fraction "Plastics" corresponds to the target fraction "plastic, mixture". Therefore this can be applied directly.
This method of using production input data to estimate waste data is flawed with respect of assuming that all polymer types have the same short lifetime. In a market that has not reached a steady state or plateau this means that polymer shares in production are not the same as polymer shares in disposal.
LCI calculation tools for regionalised waste treatment – General introduction (2020)
Technical report, version 2, Zurich, July 2020
- Patterns of household waste disposal methods in developing countries vary according to climate, housing conditions, availability and cost of waste collection services, local regulations, cultural and other factors. Also the characteristics of the waste itself (smell, attractiveness to flies and rodents) determines disposal habits.
Brazil
- sanitary landfill in Brazil are very diverse.
- 25% (147) reported to have neither base seal, nor gas collection pipes, nor any form of leachate collection and treatment.
- Incineration is only a targeted treatment for health care waste, septic waste and food waste from ports and airports. Incineration of household waste can therefore be considered negligible in the current Brazilian situation.
- Waste incineration is usually not practiced in all of Latin America. Only Brazil and some Caribbean islands have experience with urban solid waste incinerators (PAHO 2010:130).
India
- Urban households and businesses usually collect waste in a single bin. Waste separation at the source is not commonly performed.
- a rate of 88% all generated municipal waste will probably end up
in open dumps and other unhygienic treatments - The Indian national average landfill gas capture rate estimated for 2007 was very close to zero, as only a few small pilot projects in large cities exist.
- 6 waste incinerator plants existed in 2015; 12 facilities for refuse derived fuels (RDF); 600 digester plants for biowaste existed; 95 local bodies of a total of 203'700 have set up sanitary landfills
South Africa
- In 2014 66% of all households having municipal waste collection services while others having their own informal refuse dumps or communal waste dumps (no collection service) or simply littered their waste.

- “disposal to land” signifies an engineered landfill, while “disposal to landfill” is coined for more specific disposal in a non-engineered landfill (informal and open dumps).
European Database for Corrugated Board Life Cycle Studies
Closed-loop approach
To analyse an open-loop system, the inputs and outputs from the linked systems have to be studied.Calculation for one tonne of corrugated product
The closed-loop system assumes the ideal case that no recovered fibres are lost from the production shavings and the collected corrugated board after use, and that the fibre quality remains constant due to the reprocessing of the fibres. The primary fibre is thus recycled several times within the system.
Environmental effects of plastic waste recycling
European Commission, Joint Research Centre, Tonini, D., Garcia-Gutierrez, P., Nessi, S., Environmental effects of plastic waste recycling, Publications Office, 2021, https://data.europa.eu/doi/10.2760/955772
Summary and abstract
- EU level
These include Polyethylene Terephthalate (both amorphous and bottle-grade), High-density Polyethylene, Low-density Polyethylene, Polypropylene, Polystyrene, Expanded Polystyrene, Polyurethane, and Polyvinylchloride.
about 1140-3573 kg CO2-eq./t polymer waste achieved when one additional tonne of plastic waste is recycled comparing alternative treatments, including a mix of incineration and landfilling.
Savings are highest for recycling of Polyurethane and bottle-grade Polyethylene Terephthalate, and when recycling displaces incineration, due to the avoided CO2 emissions from combustion of fossil carbon in polymers.
In a broader perspective, considering that the annual generation of plastic waste in the EU is estimated to about 29.1 Mt, a total (additional to what achieved today with current recycling) annual GHG saving potential of nearly 17.6 Mt CO2-eq. can be estimated under the assumption that 70% of the investigated polymer waste currently non-collected (i.e. landfilled or incinerated) is instead collected and sent for recycling, and assuming constant conditions for technology efficiencies and energy systems (as of today). This corresponds to the average impact of 2.3 million of EU citizens. Under the hypothetical scenario that 100% of the investigated polymer waste were collected for recycling, the annual GHG savings would reach about 25 Mt CO2-eq. The results of this study are highly relevant for circular economy policies related to plastics and for informing how the circular economy can contribute to the objectives of the EU Green Deal, especially in respect to decarbonisation.
plastic waste collected and sent for recycling are as low as 32.5% for post-consumer plastic waste as a whole, and 42% for plastic packaging waste (PlasticsEurope 2020; data for EU28+NO+CH).
For example, for post-consumer plastic packaging waste Antonopoulos et al. (2021) estimated a final recycling rate16 of about 14% within EU27 (25% when assuming that all plastic waste collected, sorted and exported outside EU27, e.g. to Asia, is also fully recycled) using a dedicated material flow analysis.
See the recycling rate difference caused by plastic waste exported outside EU.
A significant portion of the generated plastic waste is therefore currently disposed of in landfills, incinerated, or exported outside EU, thus incurring loss of valuable resources alongside environmental emissions, primarily (but not limited to) CO2 from the oxidation of the fossil carbon in the incinerated plastic material.
1 Introduction
In view of this situation, the European Commission has set ambitious targets on the recycling of plastic packaging waste, i.e. 50%, 55%, and 60% of the amount generated to be achieved by 2025, 2030, and 2035, respectively (European Parliament and the Council, 2018; amendment to Directive 94/62/EC on Packaging and Packaging Waste).
Recycling of post-consumer plastic packaging waste in the EU: Recovery rates, material flows, and barriers
Waste Management
19 April 2021
Ioannis Antonopoulos, Giorgia Faraca, Davide Tonini
European Commission Joint Research Centre, Calle Inca Garcilaso 3, 41092 Sevilla, Spain
Highlights
- Recovery rates are higher for PET and HDPE and lower for films, PP, PS.
- Current EU27 PPW recycling rate is 15% excluding the exported waste (25% otherwise)
- Presence of films in the input-waste hampers recovery of target materials.
- Substantial improvements are needed in the recycling chain, primarily the collection.
1. Introduction
European Parliament and Council Directive 94/62/EC of 20 December 1994 on packaging and packaging waste
https://eur-lex.europa.eu/legal-content/EN/TXT/?uri=CELEX%3A01994L0062-20180704
Questions & Answers: A European strategy for plastics
16 januari 2018
https://ec.europa.eu/commission/presscorner/detail/sv/MEMO_18_6
In the EU, the potential for recycling plastic waste remains largely unexploited. Around 26 million tonnes of plastic waste are generated in Europe every year. But less than 30% of such waste is collected for recycling. Of this amount, a significant share leaves the EU to be treated in third countries, where different environmental standards may apply.70% of plastic waste is put in landfills or incinerated.
What’s more, the cost of incinerating plastic waste is high. The potential annual energy savings that could be achieved from recycling all global plastic waste is equivalent to 3.5 billion barrels of oil per year. Not to mention the effect on the carbon footprint – recycling 1 million tonnes of plastics is the equivalent of taking 1 million cars off the road.
The new rules fix a new target of 55% recycling of plastic packaging waste by 2030, set a ban on landfilling separately collected waste and fix stronger arrangements for extended producer responsibility (EPR) schemes.
According to recent scientific data, single-use plastics represent half of all marine litter. It has been forecast that by 2050 there will be more plastics than fish in the oceans, by weight.
About two-thirds of plastic waste comes from packaging.
Today’s situation where 31% of plastic waste goes to landfill and 39% to incineration means loss of precious resources and is not acceptable. This will require investment in collection, sorting and recycling infrastructure; and improving the traceability of materials and substances in materials so that the correct recycling technology can be applied.
Plastic waste and recycling in the EU: facts and figures
Updated: 30-06-2021 - 14:01
Created: 19-12-2018 - 14:58
News from EU parliament
- Nearly a third of plastic waste in Europe is recycled.
- Plastic production by type: 39.9% Packaging, 19.8% Building and construction, 9.9% Automotive, 6.2% Electrical and electronic equipment.

Guidance for the compilation and reporting of data on packaging and packaging waste according to Decision 2005/270/EC
3 Guidance for the preparation of data for reporting
3.1.1 Placed on the market data
One method of obtaining waste generation data is based on the collection of data on the amount of packaging waste placed on the market (PoM). As stated in Article 6a of the Directive:
“Member States shall calculate the weight of packaging waste generated and recycled in a given calendar year. Packaging waste generated in a Member State may be deemed to be equal to the amount of packaging placed on the market in the same year within that Member State.”
Typically, producers provide information on the amount of packaging PoM through an Extended Producer Responsibility (EPR) scheme.
3.1.1.7 Best practice example - Netherlands
In the Netherlands, PoM data is collected through the national EPR scheme, run by Afvalfonds Verpakkingen. Producers/importers of packaged products are required to report PoM data as part of their essential EPR requirements.
The Netherlands sets a de minimis producer/importer reporting threshold of 50,000 kg per year of packaging PoM. While only 3% of companies placing packaging on the Dutch market fall above this de minimis threshold, these companies account for 93% of the market. Afvalfonds Verpakkingen then estimates the weight of packaging PoM by producers/importers falling below the de minimis threshold, based on a survey it has undertaken in order to understand the gaps in the PoM data.
Afvalfonds Verpakkingen also cooperates with municipalities and companies as part of the Netherlands’ Packaging Agreement, under which the EPR system collects money from producers/importers and remunerates municipalities for packaging collection costs. In addition, a quality protocol between Afvalfonds Verpakkingen and municipalities defines the quality criteria for all collected materials.
Afvalfonds Verpakkingen (Packaging Waste Fund Foundation in the Netherlands)
By 2020, 82% of all packaging released on the market was recycled. This figure is well above the Dutch target of 70% and means that we also well exceed the EU target of 55%.

They are recycling rates of plastic under the category of packaging
3.1.2.3 Best practice example – Ireland
The data are processed and compiled by the Irish Environmental Protection Agency (EPA).
The system differentiates between packaging waste that is recycled and packaging waste that is not recycled, with a different approach to collecting data on each. In general, the measurement point for the former is outputs from waste treatment facilities, while the measurement point for the latter is at the point of waste collection. The sum of the two is assumed to be the total packaging waste generated; adjustments are made where necessary.
To estimate the packaging content of mixed non-recycled waste, the EPA applies national factors determined by waste compositional analysis. These studies are well developed and control for geographical, seasonal and socio-economic variations as far as possible.
Irish Environmental Protection Agency (EPA)
Key findings for 2019
3.2 Recycling
Esterification is the process of combining an organic acid (RCOOH) with an alcohol (ROH) to form an ester (RCOOR) and water ↩︎
it is assumed that all electricity is generated from lignite (LHV: 9.9 MJ/kg) and all heat from light fuel oil (LHV: 42.8 MJ/kg). This scenario might be representative of parts of Eastern Europe. In the renewables option (S-1.2), electricity from hydro power (100%) and heat from biogas (50%) and biomass (50%) are considered as examples. This or similar scenario could be relevant in the future for some European countries (e.g. Scandinavian). ↩︎
The polymer is not kept intact, but valuable materials (feedstock, monomers) are being recovered. ↩︎
This chemical recycling technology resembles a high temperature gasification. For this technology the polymer is used as a refuse derived fuel and is transformed in a gasifier to syngas with a H2/CO molar ratio of 2:1. The quantity of syngas and the accompanying CO2 emissions depending on the polymer type. ↩︎
For this chemical recycling technology the polymer is used as a refuse derived fuel and is converted to pyrolysis oil, assumed equivalent to diesel. The energy content of the diesel depends on the polymer calorific value. ↩︎
For this chemical recycling technology, the polymer is used to obtain medium length hydrocarbon (碳氢化合物,烃) chains (C10-C14) to replace paraffin like waxes, which can potentially be used to replace lubricating oils as well. ↩︎
The polymers are gasified at a medium to high temperature and a gas with a mix of chemicals are obtained, including BTX (a mixture of benzene, toluene and xylenes), monomers and short carbon molecules (C2-C5). The output can be used to make new polymers. The chemicals formed strongly depends on the polymer. An important requirement for monomer recovery is product separation. ↩︎
The polymer is pyrolyzed on a medium temperature and an oil with a mix of chemicals is obtained, which include monomers, BTX (a mixture of benzene, toluene and xylenes) and shorter carbon molecules. These can potentially be re-used for making new polymers and the chemicals formed strongly depends on the polymer. An important requirement for monomer recovery is separation of the remaining oil. ↩︎
/‘diː,pɒlɪməraɪ’zeɪʃən/ With this chemical recycling technology, ethylene glycol is added to specific polymers (PET, Nylon 6) in the presence of a catalyst, the polymer is depolymerized to its building blocks, which can be re-used in making new polymers. ↩︎
For specific biopolymers (in this case, PLA), the polymer can be dissolved in water when heated up and broken down to its monomer building blocks. These monomers can be re-used in making new polymers. ↩︎
The material is incinerated and fully destroyed. However, the high calorific value of plastic results in recovery of energy as heat and electricity. The amount of heat and power depend on the calorific value (energy content) of the polymer and the configuration of the waste-to-energy plant. ↩︎
- sorting (receive pure-coloured PET bales in recycling plants in Switzerland); 2. cut the wire of PET bales; 3. pass through a metal separator (separates aluminium-containing labels); 4. shredded with knives to 12 mm size in the mill; 5. air separator separates the label residues from the PET flakes (labels to incinerator); 6. Sink in water where caps separated (caps for PE recycling); 7. flakes purified by heating at 200 degree with 50% sodium hydroxide; 8. washing and drying.
amorphous (no definite shape) and bottle grade. For bottle grade, the viscosity of the recycled flakes is increased to a comparable level of primary PET by solid state polymerization (SSP). Data were derived from involved recycling facilities). About 40’000 t of PET bottles per year are collected in Switzerland and further processed to bottle grade (30 % recycling content) or amorphous (50 % recycling content) PET granulate. 20 % of the PET cannot be recycled again and is incinerated. Data for the PET recycling processes were derived via PET Recycling Schweiz (PRS). ↩︎
a manufacturing process that’s well suited for different applications across a broad range of industry sectors. Blow molding is an engineering procedure in which hollow plastic forms such as water bottles and juice bottles are formed. ↩︎
Landfill gas (LFG) is a natural byproduct of the decomposition of organic material in landfills. LFG is composed of roughly 50 percent methane (the primary component of natural gas), 50 percent carbon dioxide (CO2) and a small amount of non-methane organic compounds. ↩︎
Calculated based on the amount of recycled material ultimately obtained, considering the whole recycling chain (collection, sorting, and reprocessing into pellets, flakes and granules). ↩︎
