China’s plastic import ban increases prospects of environmental impact mitigation of plastic waste trade flow worldwide
Nature Communications
Published: 18 January 2021
Zongguo Wen
State Key Joint Laboratory of Environment Simulation and Pollution Control (SKLESPC), School of Environment, Tsinghua University, China
Table of Contents
Introduction
- Plastic waste treatment methods and technologies vary between countries, likewise the environmental impacts of treating 1 kg of plastic waste have great disparity.
- The incineration and recycling rates in developed countries are generally much higher than those in developing countries with landfills as their main disposal means, which implies that the changes in global plastic waste trade flow influence the already existing environmental impacts to a large extent.
- Sample countries included China, “17 countries (and regions)” which accounted for 92% of plastic waste imported to China, and “other countries”.
- Environmental impacts and the corresponding Eco-cost of these changes in global plastic waste trade flow patterns through life cycle assessment (LCA).
- Fully took into account changes in the environmental impact due to technical differences among countries, including diversities of technological structure and advancement.
- Scenario Analysis (SA): (1) Export Reduction Scenarios assuming plastic waste exports from developed and developing countries plunged by 50% jointly or singly against 2018 volume, and (2) Recycling Rate Promotion Scenarios premise that the recycling rates of all countries are increased by 20%, 50%, and 100% compared to the 2018 scenario.
Results
Changes in plastic waste trade flow pattern
Fig. 1: The trade flows of six types of plastic waste under two scenarios.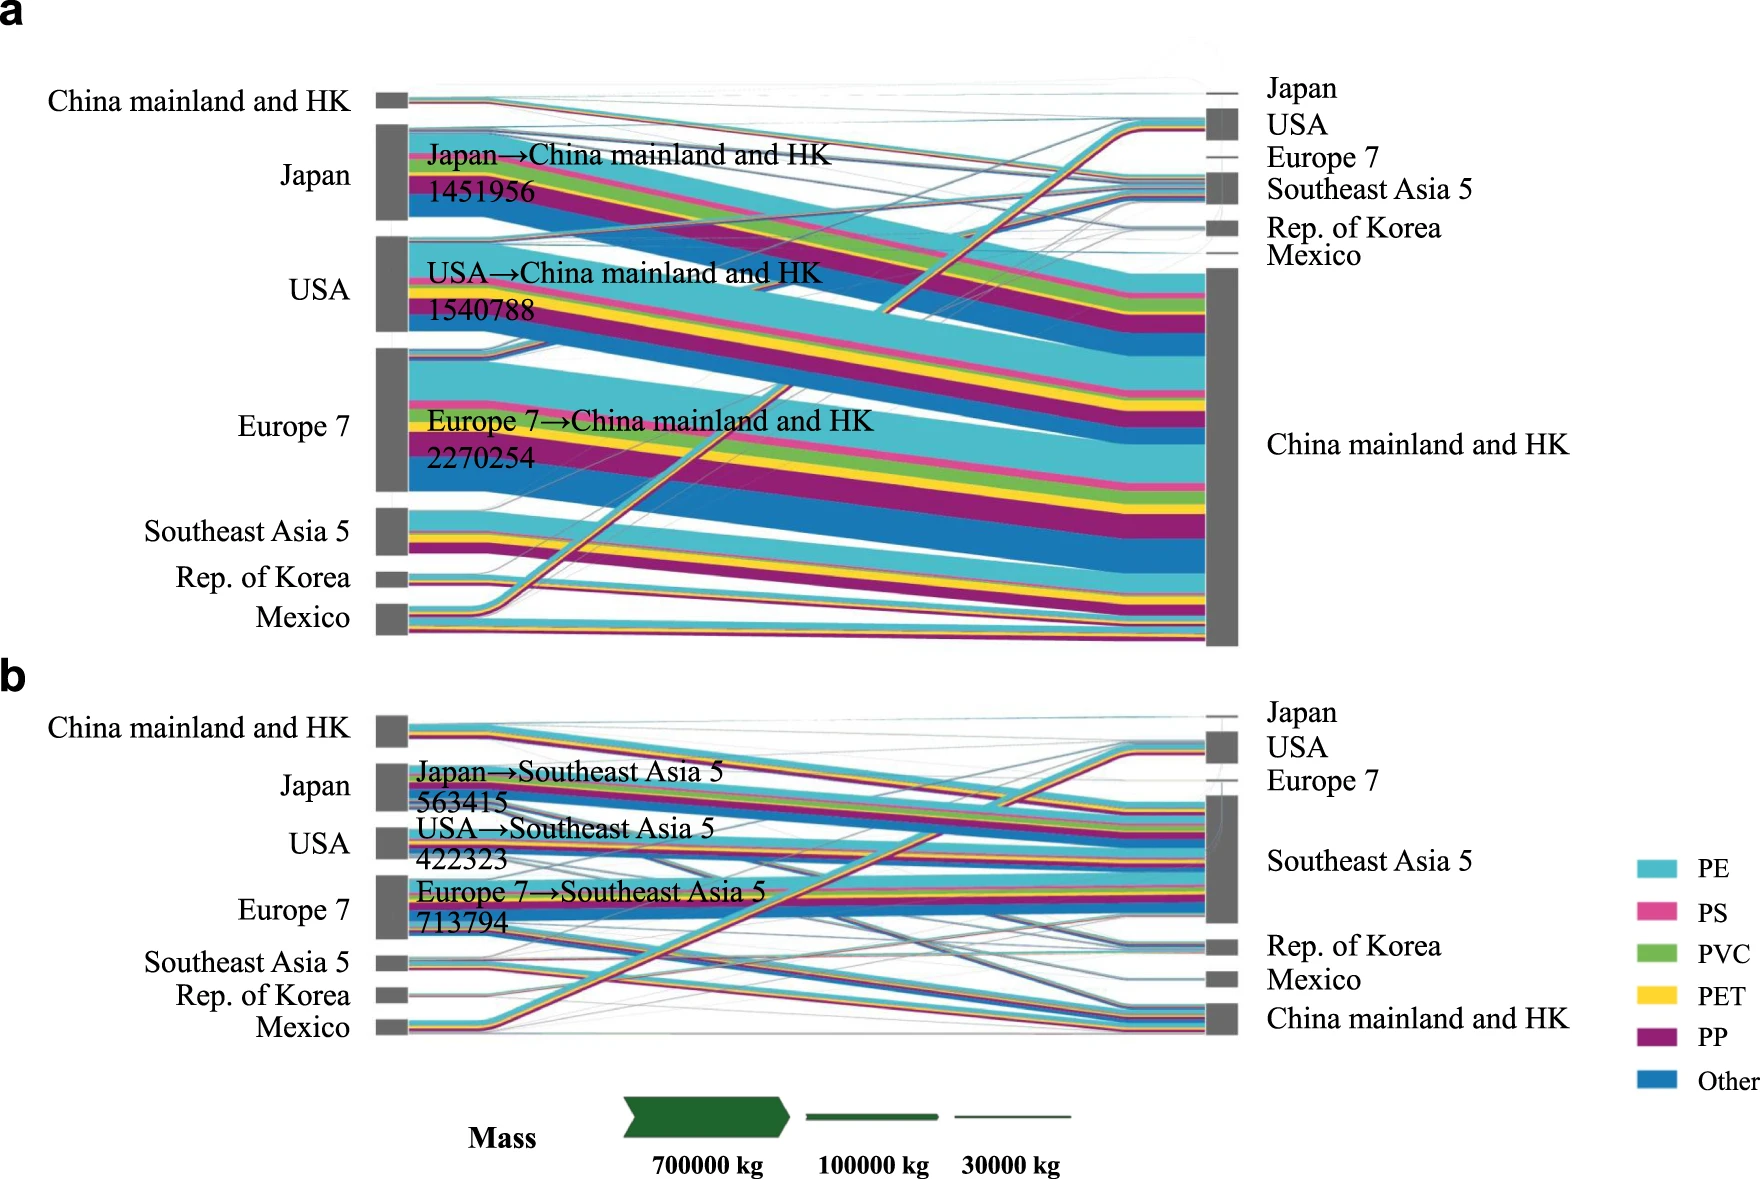
a presents the global trade flows of six types of plastic waste prior to the ban (Baseline Scenario), while b presents the flows subsequent to the ban (2018 Scenario). The unit of the flows is tons. The data source of a and b is shown in Supplementary Tables 1 and 2. The flows of six types in the Figure are based on estimation (Supplementary Table 4).
Country list (7 country groups) in Sankey diagram:China mainland and HK, Japan, USA, Europe 7, Southeast Asia 5, Rep. of Korea, and Mexico.
Flow components (six plastic groups): PE, PS, PVC, PET, PP, and Other.
Before Ban, mainland China and HK imported 55.7% and 22% of global plastic waste, while USA, Japan, and Europe 7 exported 77.9%, 87.6%, and 57.5% of plastic waste to mainland China and HK.
After Ban, Japan, the USA, Germany, and the UK, accounted for 46.1% of the world trade flow of plastic waste. Malaysia became the top export destination (12.2% of the total) among 18 sample countries.
In 18 countries, only China and Belgium had increments in exports.
Southeast Asia 5 became the major export destinations where proportions of flows rising from 4.34% to 55.9% for Japan, from 5.24% to 46.5% for the USA, and from 6.1% to 33.0% for Europe 7.
The import flows of Southeast Asia 5 rose to 3.62 times that of the Baseline Scenario (Japan 25.8%, the USA 19.4%, Germany 11.7%, Hong Kong 10.3%, and the UK 9.8%.)
An increase in intra-Europe flows.
There may be a downward trend of plastic waste flows from developed countries to Southeast Asia after 2018.
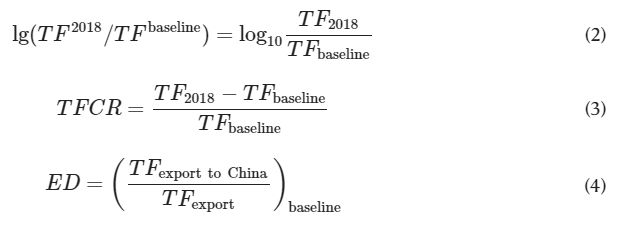
Fig. 2: The relationship between Export flow change rate and ED.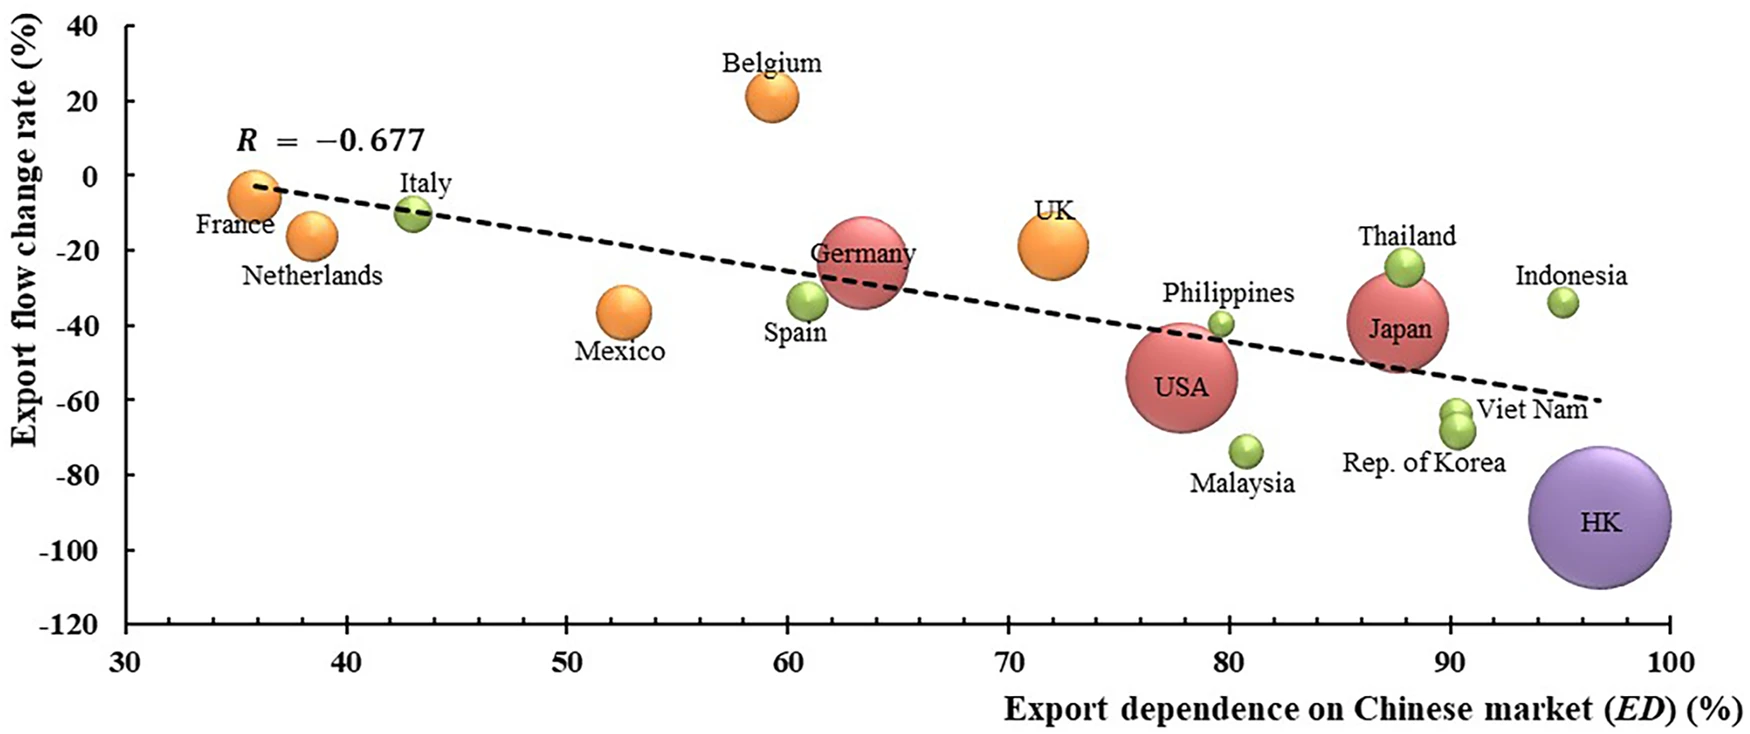
Export dependence on the Chinese market (ED) is defined as the proportion of export flows to mainland China and Hong Kong in the total exports of a country under the Baseline Scenario. The bubble shape size indicates the total Baseline export flow of the countries, according to which countries are divided into four categories and identified by four colors.
- If a country relied heavily on the Chinese market, its trade structure would be vulnerable and easily influenced by abrupt changes such as the China ban.
Disagree with “trade structure”, which should be changes in trade volumes
Environmental impacts of changes in waste trade flowsand treatment system structures
- Taking into account domestic management, export, and transportation.
- Treatment of 1 kg of plastic waste was chosen as the functional unit.
Fig. 3: System boundaries for LCA of EIT (Environmental Impact of Trade flow changes).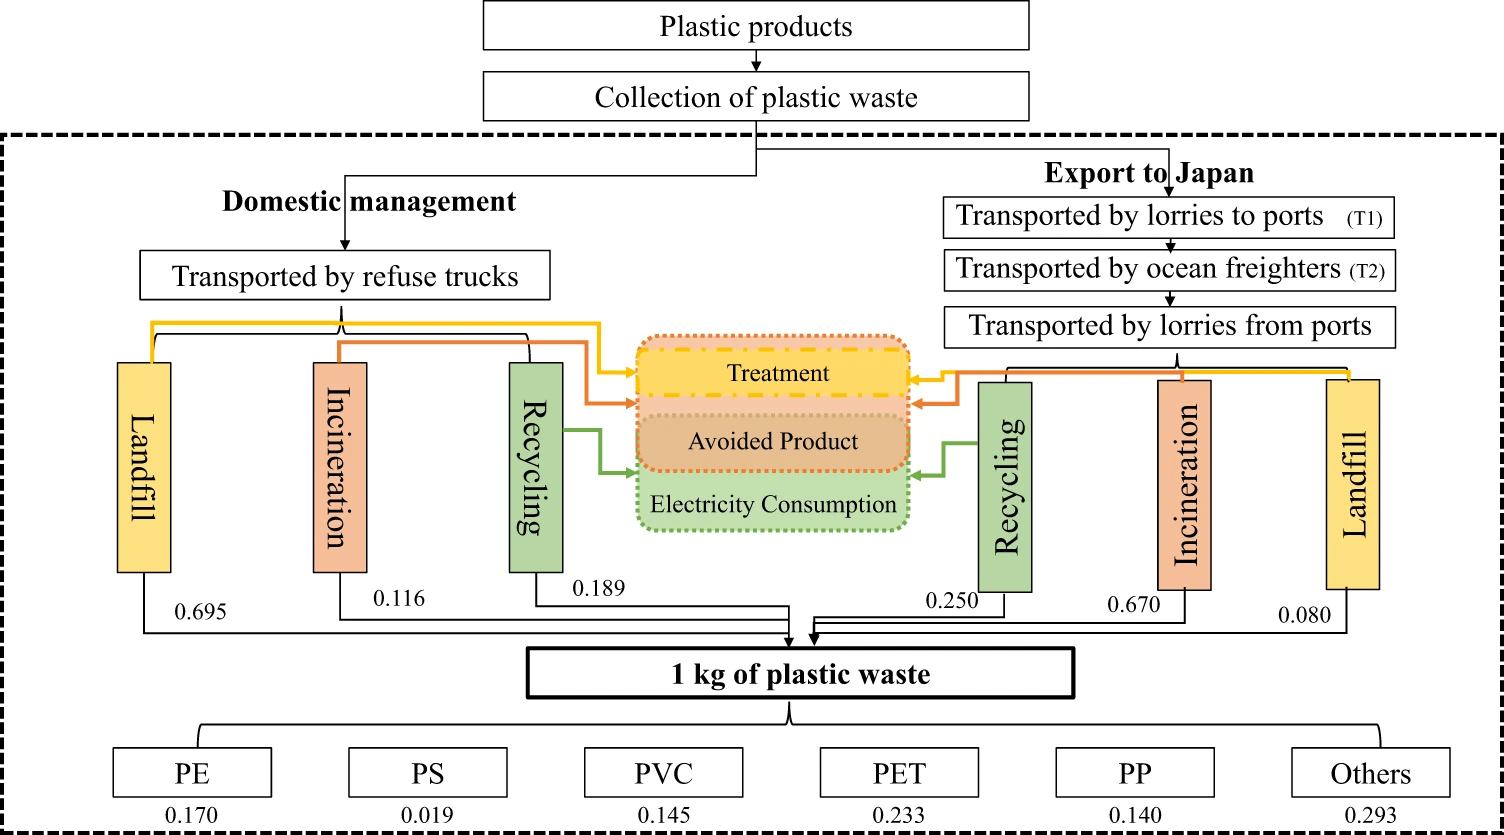
Whether we can complement the treatment of “mismanaged”? As it makes an effect on the environment, such as end up with marine litter
Should the process of energy recovery by incineration be considered as a mitigation way of CO2?
Here, China’s export to Japan under the Baseline Scenario is taken as an example. The dotted line is the system boundary. The proportion of different types of plastic waste generated in China is shown at the bottom of the Figure. For example, PE accounts for 0.170 kg of 1 kg of plastic waste. For every 1 kg of plastic waste (generated by China) treated domestically, the environmental impact of transportation by refuse trucks are considered together with the environmental impact from the three treatment options of China. Whereas, when exporting to Japan, both the environmental impact of sea and land transportation are considered first, then that from plastic waste treatment options in Japan.
- The EIT of one trade flow exported from Country i to Country j is defined by the formula below:

- $EX_{ij}$ is the export flow (in kg) from i to j in Baseline Scenario and $EX′_{ij}$ is that of 2018.
- $DM_{ij}$ and $Exp_{ij}$ are the environmental impacts of treating 1 kg of plastic waste, generated from Country i, by Country i and j respectively.
- $tran_ij$ is the environmental impact of transporting 1 kg of plastic waste from Country i to j, which is corresponding to the process of T1 and T2 in Fig. 3.
Confused equation as $DM_{ij}$ and $Exp_{ij}$ will also change under the two scenarios. The correct form should be $EIT_{ij}=(EIT_{DM_{ij}})+(EIT_{Exp_{ij}})+(EIT_{tran_{ij}})$
- Differ from the shares of three treatment options between the baseline and the 2018 scenario for some countries: the landfill rate declined, recycling rate rose while incineration rate fluctuated slightly.
- The recycling and incineration rates of plastic waste in developed countries are generally higher than that in developing countries where landfill plays the dominant role in waste treatment.
Fig. 4: EIT and Eco-cost of the China ban for 2018 Scenario.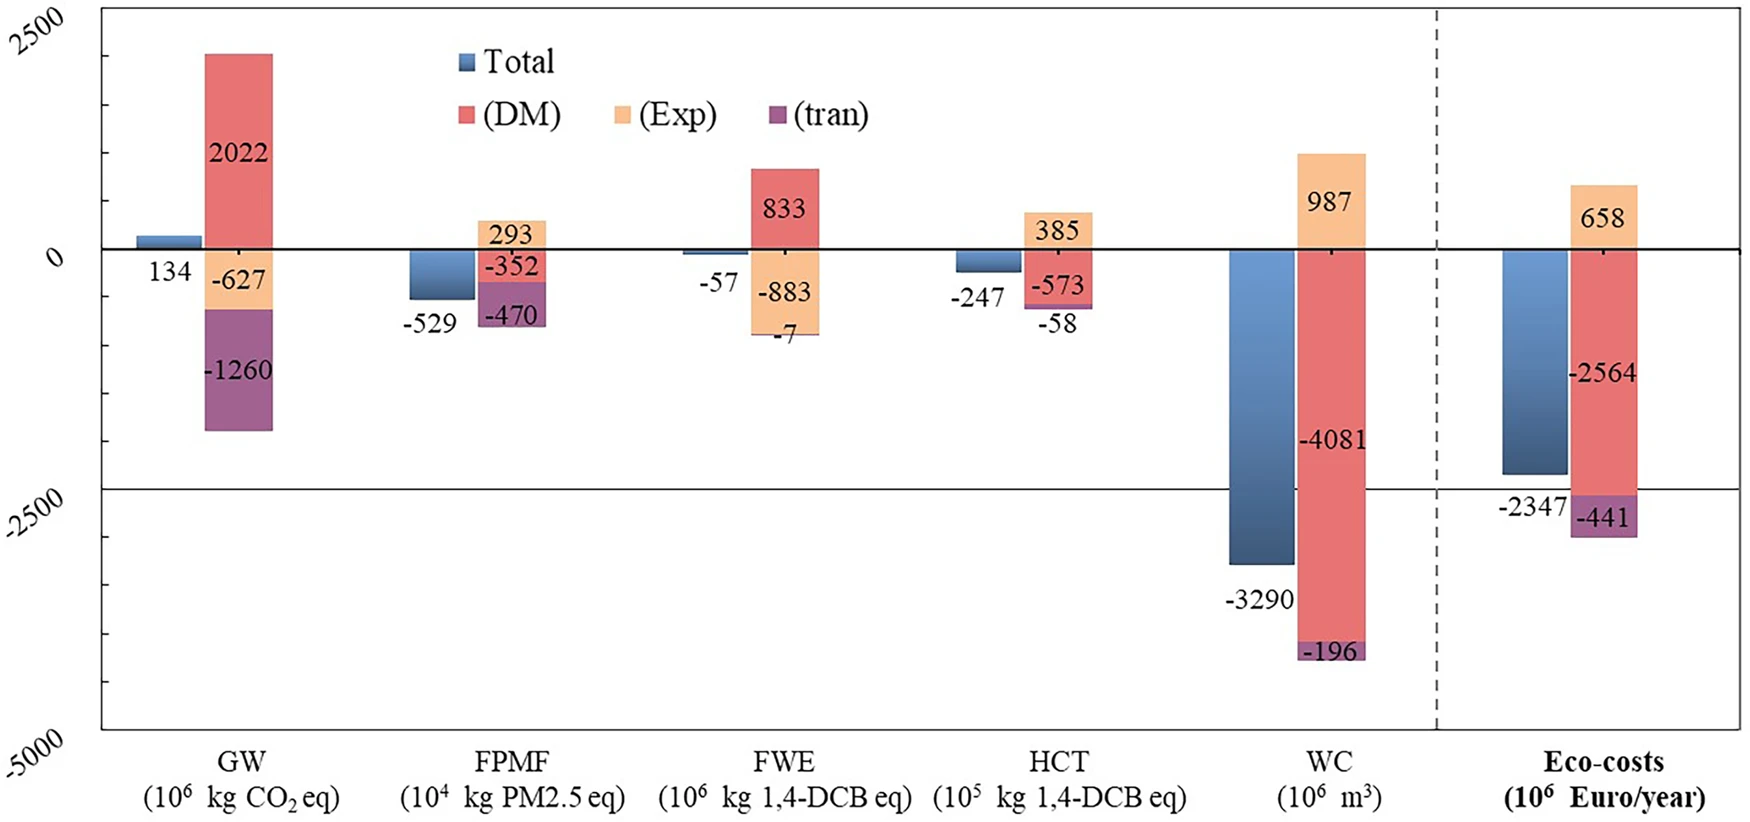
Note that an item has a beneficial environmental impact when its value is negative. To enhance the visibility of midpoint indicator values on the ordinate axis, the unit of each indicator was adjusted as shown in the brackets at the bottom of the Figure.
- Five midpoint indicators of ReCiPe 1: global warming(GW, kg CO2 eq), fine particulate matter formation (FPMF, kg PM2.5eq), fresh water ecotoxicity (FWE, kg 1,4-DCB eq), human carcinogenic toxicity (HCT, kg 1,4-DCB eq) and water consumption (WC, $m^3$)
- high per capita GDP (-> high high incineration rates) -> high unit impact values of incineration -> high impact of global warming
Quite interesting to investigate the relationship between the plastic waste trade and global warming. Whether developed countries tend to have a higher incineration rate or a higher unit impact value on global warming? And the trade to some extent facilitates the mitigation of global warming?
- the above logical chain explains why the impact of GW domestically is higher than the impact of exporting them abroad (most developing counties).
- Countries with huge flow change account for huge impacts: Japan, the USA, Hong Kong, and Germany.
Methods
- 17 countries are selected which account for over 92% of plastic waste imports to China.
- Baseline Scenario: the average value of trade data from 2013 to 2016 (or 2008 to 2016 if it fluctuates greatly). 2017 is excluded as it differs from both sides.
For me, setting the average value of 18 and 19 as the baseline scenario while 20 and 21 as the Covid-19 scenario
- Several indicators to show waste export dependence on China’s market.
how to show changes after covid19, reflecting on flows? or environmental impact? a bubble figure with two axes, one for trade flow changes, one for environmental impact changes. Bubble volume for what? Indicators of environmental impact, global warming, particulate matter, fresh water ecotoxicty, human carcinogenic toxicity, etc
- SimaPro 8.5.2, which employs the ecoinvent database.
- Eco-cost method2: the average marginal prevention costs of midpoints of different impact categories, and has the advantage that the output is expressed in an intelligible monetary value (2017 Euro, €). The so-called prevention cost is the economic cost to reduce environmental pollution and materials depletion.
ReCiPe is a method for the impact assessment (LCIA) in a LCA. Life cycle impact assessment (LCIA) translates emissions and resource extractions into a limited number of environmental impact scores by means of so-called characterisation factors. ↩︎
