(Course) LCA Practice & Reporting 21-22
Jeroen Guinee and Bernhard Steubing
Intensive theory week (5 days; 9 to 5)
Table of Contents
2122-S1 LCA Practice & Reporting - Theory Week: Lectures
1. Introduction LCA-PR
Overall aim: provide sufficient scientific basis and practical skills to perform an attributional life cycle assessment (ALCA) study.
• Draft a concise, to-the-point proposal for their own LCA research including a brief
literature review
• Perform a methodologically consistent and proper LCA study
• Develop a proper LCA model in CMLCA
• Present results, identify problems and propose solutions
• Plan and monitor research
• Report an LCA study and its findings transparently and comprehensively
• Identify, justify and report LCA’s key methodological assumptions and choices
• Critically evaluate and discuss the possibilities and constraints of their LCA study.
Assignment 1: Research proposal
Proposals should demonstrate the environmental relevance of the chosen case study with existing literature as well as provide justification for the use of LCA in their specific applications. The goal of the research proposal is for students to formulate the research question (including a hot spot analysis), identify challenges and make a work plan.
Research proposal requirements and guidelines
As preparation for drafting the research proposal, students are required to read the article by Hengl and Gould (2002): https://www.itc.nl/library/papers/hengl_rules.pdf. Proposals are graded according to how well the student follows the requirements below.
Format and submission requirements
• Proposals must be submitted through Brightspace (Leiden) / Assignments (use the similarity check to resolve any outstanding issues prior to the due date).
• Max. 2000 words including a maximum 300 words abstract, Tables, Figures, frontpages, etc., while excluding only references and appendices.
Content requirements
• Title and student name
• Abstract (300 words): Define the research question(s), propose an LCA case study, describe the scope and discuss your approach. Tell us why the case study is important and why a life cycle approach is necessary. The abstract at this point should make your audience want to know more about your study without necessarily having the final results.
• Introduction (problem statement, literature review, research question, …. ): Include background information, previous research on the topic (including LCA literature). Here, you will use existing literature (at least 2 reference LCA studies) to construct the problem statement and identify a knowledge gap. For example, “all studies so far focus on the comparative advantages at the use phase, while neglecting manufacturing and processing which may not compensate for gains in efficiency. This study takes a life cycle approach to evaluate the systemic environmental implications of A and B and determine if there is an environmental advantage to either one. Moreover, hot spots are identified for both alternatives”.
• Goal and Scope Definition: Under goal definition include a brief discussion on goal, intended application of your study, researcher, commissioner, target audience, steeringcie, expert reviewer. Under scope definition include a brief discussion on ALCA/CLCA, detailed LCA, temporal/geographical/technology coverage, coverage of processes and of interventions and impacts. Finally, discuss function, FU, alternatives, and reference flows.
• Flowcharts: Preliminary flowcharts following the conventions learned during the Theory week (no copy from literature). One flow chart per alternative.
• Method: This section outlines how you will proceed with your LCA. This includes data collection (identified data sources), impact assessment families applied, recycling, and allocation.
• Fulfillment of model requirements (pg. 8). Discuss how you will meet the model requirements (see below under assignment 3).
• Discussion: Identify possible difficulties and their solutions. This is an opportunity to identify areas that may be challenging. Along with the challenges, try to propose a solution (even if it is too early) as you can get feedback on how you plan to proceed.
• Planning: Provide a schedule for the work plan. This should include all phases of LCA as presented during the Theory Week as well as the milestones (assignments) and possible periods that you will not be able to work on your case study.
• References: Use the format of the Journal of Industrial Ecology (Harvard style) to organize your references (https://jie.yale.edu/jie-style-guide-accepted-manuscripts) and/or use a reference manager using the correct (JIE) export settings or Word import settings. Include relevant and sufficient
Advice
Use the theory week to think, talk and discuss your ideas with the group;
Use the terminology you learned during the theory week (glossary);
Time is limited, focus on the course requirements and don’t set your additional requirements too high. For example, leave the “Life Cycle Stage contribution analysis” for the end.
While waiting for our feedback you can already start doing your research, use all the time you have.
Assignment 2: Presentation
Assignment 3: Final report
For the LCA-PR course the student is expected to perform a methodologically consistent and proper LCA case study based on what has been taught during the Theory Week. The student needs to submit a properly structured and type-written report, along with the CMLCA-file (‘model’) that is created for the LCA study. Through the report and the CMLCA-file, the student should convince the course instructors that (s)he understands the LCA theory, how to apply the theory in practice in a case study, and how to interpret an LCA study’s results taking into account the proper use and constraints of LCA.
The results of the case study performed during the course cannot generally classify as a full LCA. Instead, this is more of an educational exercise. Please have this in mind when performing your case study.
Model requirements (Mandatory!)
In addition to the use of the background ecoinvent v3.4 database, the student should model (in CMLCA) at least 5 foreground unit processes including:
• 1 disposal process (modelling waste flows out and not waste services (as goods) in!)1
• 1 closed-loop (reuse or closed-loop recycling);
• 1 multifunctional co-production process (not open-loop recycling, but co-production process!) (explicitly reporting on all 4 steps as learned during the Theory Week; see last slide of the Allocation presentation); applying two ways (of which one may be a sensitivity analysis) of allocation including economic allocation2;
• 1 unit process with at least 3 environmental emissions (extensions) calculated by the student3. Note that directly gathering values from literature does not count;
• at least (!) 1 additional unit process free of choice.
The closed loop process also needs allocation but this does NOT count as the multifunctional process at the same time, so you need to model these two processes separately.
Next to the modeling the work should also include a comparison of (at least) two product alternatives, a full impact assessment (not just a couple of impact categories) selecting two families (at least the PEF as baseline, and the CML or ReCiPe family as sensitivity analysis), at least two types of contribution analysis (applying the built-in functions of CMLCA, e.g., at the level of process contributions to category indicator results and at the level of process-emissions contributing to category indicator results for all impact categories, optionally grouping processes manually into stages (which is not the same as a contribution analysis by life cycle stage (LCS or ‘big ship’ analysis), etc.; applying the LCS (or ‘big ship’) contribution analysis is optional, not (!!) mandatory but can deliver extra points when properly performed) and several sensitivity analyses (at least three: one on allocation (see above), one on characterization families (see above); and one free choice, preferably based and justified by your contribution analysis results). Finally, the student should report in a short table how these model requirements have been dealt with in the report.
Reporting
Students should use the mandatory report lay-out presented below. Next to that the ISO 14040 guidelines should be followed to report the LCA work done. Additional guidance on reporting can be found in the Handbook on LCA, which includes elaborated reporting guidelines on the basis of these ISO reporting guidelines. It is strongly recommended to use the Handbook for this. The abstract should not exceed 300 words. The main report should not exceed 6000 words (no range; 6000 is the limit), including Tables, Figures, frontpages, etc., while excluding only references and appendices. but excluding references and supporting information. Any text beyond 6000 words will not be taken into account for grading, although appendix/appendices may be provided in which the student provides supporting information (no page limit). Don’t forget to insert page numbers in your report! Data reporting is crucial! Students should use the CMLCA unit process data format to present the data for their foreground processes, and in the main report and appendices (supporting information) they should clearly document how they got from the raw literature/internet data to the eventual unit process data implemented in their CMLCA file, including all assumptions, calculations and sources used.
Finally, you need to carefully think what to put in the main report with the word limit, and what to put in Appendices. You cannot “outsource” important information to the annexes. All important information needs to be in the main text, and appendices should be made for the inventory table, classification tables and further detailing of information (e.g., of process data) included in the main report. Teachers should be basically able to understand your case study, assumptions, data, results etc. by reading the main report only.
Mandatory report lay-out
All points below should be addressed in your final report. You can add other topics (for example, contribution analysis by life cycle phase and/or uncertainty analysis) but these need to be covered at the correct location in your report according to the ISO14040 structure and the LCA Handbook. Instructions on how to describe specific topics can be found in the LCA Handbook.
- Abstract (less than 300 words)
- Table of contents
- Course modelling requirements in a Table with process numbers and short explanation
- Introduction
- Goal and scope definition
a. Goal definition
b. Scope definition
c. Function, functional unit, alternatives, reference flows - Inventory Analysis
a. System boundaries:
i. Economy-environment system boundary
ii. Cut-off
b. Flowchart
c. Data collection and relating data to unit processes
d. Multi-functionality and allocation, report all 4 steps for all your foreground processes in the main report indicating the criterion used to determine between Goods and Wastes and summarizing the other 3 steps in, e.g., a table:
Don’t forget to add how you solved the multifunctionality of these processes and how you calculated the allocation factors and which data you used for that.
e. Results of inventory analysis (Inventory table in appendix and briefly discuss 2-3 examples) - Impact assessment
a. Impact categories, characterization models, category indicators, characterization factors (explain which family/-ies you chose and why, report briefly on related characterisation models, indicators and factors showing understanding)
b. Classification
c. Characterization results and discussion
d. Normalisation results and discussion
e. Interventions for which characterization factors are lacking (include as appendix and briefly discuss 2-3 examples)
f. Economic flows not followed to system boundary - Interpretation
a. Consistency check
b. Completeness check
c. Contribution analyses
d. Sensitivity analysis - Discussion
- Conclusions and recommendations
- References: Use the format of the Journal of Industrial Ecology (Harvard style) to organize your references (https://jie.yale.edu/jie-style-guide-accepted-manuscripts) and/or use a reference manager using the correct (JIE) export setting or Word import settings. Include relevant and sufficient references.
- Appendices / Supporting information
2. History of LCA
Life Cycle Assessment: Past, Present, and Future
Jeroen B. Guinée
Environ. Sci. Technol. September 2, 2010
- The study of environmental impacts of consumer products has a history that dates back to the 1960s and 1970s. Especially in a comparative context (“Is product A better than product B?”).
2.1 The Past of LCA (1970−2000)
1970−1990: Decades of Conception
- One of the first (unfortunately unpublished) studies quantifying the resource requirements, emission loadings, and waste flows of different beverage containers was conducted by Midwest Research Institute (MRI) for the Coca Cola Company in 1969.
- During the 1970s and the 1980s LCAs were performed using different methods and without a common theoretical framework. LCA was repeatedly applied by firms to substantiate market claims.
1990−2000: Decade of Standardization
- The period of 1990−2000 can therefore be characterized as a period of convergence through SETAC’s coordination (“Code of Practice”) and ISO’s standardization activities (1994)
- A key result of ISO’s standardization work has been the definition of a general methodological framework.

2.2 The Present of LCA: Decade of Elaboration
Diverging approaches have been developed with respect to system boundaries and allocation methods, dynamic LCA, spatially differentiated LCA, risk-based LCA, and environmental input-output based LCA (EIO-LCA) and hybrid LCA (69-71) that may have a tense relation with some of the basic principles of the ISO standards.
2.3 LCA Future (2010−2020): Decade of Life Cycle Sustainability Analysis
2.4 Discussion
3. Glossary, Flowchart, and Unit process
3.1 Glossary
From LCA Handbook (Guinée et al. 2002).
This glossary provides definitions of the key terms and abbreviations used in the MSc-IE LCAPR course. The glossary is copied from the LCA Handbook (Guinée et al. 2002). Terms marked with an asterisk (*) are defined in accordance with the definitions given in the ISO 1404X series of standards, although not necessarily according to the letter. For reasons explained in the LCA Handbook, several definitions adopted here deviate substantively from those of ISO. In this Glossary these are marked as “adapted from ISO”. Cross-references,
indicated by an arrow (→), point to the preferred terms used in the LCA Handbook.
Terms:
abiotic resource /ˌeɪbaɪ’ɒtɪk/:
a natural resource (including energy resources) regarded as non-living, e.g. zinc ore, crude oil, wind energy.
allocation
→ multifunctionality and allocation.
alternative
one of a set of product systems studied in a particular LCA, e.g. for comparison (note: some LCA steps are carried out for all alternatives together (e.g. selection of impact categories), while others are repeated for each alternative (e.g. characterisation).
area of protection
a cluster of category endpoints of recognisable value to society, viz. human health, natural resources, natural environment and man-made environment.
average modeling
→ proportional modeling.
background system/process
a system or process for which secondary data, viz. databases, public references, estimated data based on input-output analysis, are used in an LCA.
baseline method (model, impact category, LCA, etc.)
a method (etc.) recommended in this Guide for operationalising an LCA or methodological step.
biotic resource
a natural resource (including energy resources) regarded as living, e.g. rainforests, elephants.
casualty
human injury or death due to direct, physical cause, e.g. explosion or traffic collision (but not indirect casualties, e.g. due to toxics).
category endpoint\*
an attribute or aspect of the natural environment, human health, natural resources or the man-made environment identifying an issue of concern, e.g. loss of coral reefs or crops, damage to buildings.
category indicator\*
a quantifiable representation of an impact category, e.g. infrared radiative forcing for climate change
category indicator result\*
→ indicator result
cause-effect network
→ environmental mechanism
change-oriented LCA (consequential LCA (CLCA))
a type of LCA focusing on the environmental changes resulting from a switch to or from a particular product system or an extra functional unit of a particular product system.
characterisation\*
a step of Impact assessment, in which the environmental interventions assigned qualitatively to a particular impact category (in classification) are quantified in terms of a common unit for that category, allowing aggregation into a single score: the indicator result; these scores together constitute the environmental profile.
characterisation factor\*
a factor derived from a characterisation model for expressing a particular environmental intervention in terms of the common unit of the category indicator, e.g. POCPmethanol (photochemical ozone creation potential of methanol)
characterisation method
a method for quantifying the impact of environmental interventions with respect to a particular impact category; it comprises a category indicator, a characterisation model and characterisation factors derived from the model.
characterisation model
a mathematical model of the impact of environmental interventions with respect to a particular category indicator.
characterisation result
→ environmental profile
classification\*
a step of Impact assessment, in which environmental interventions are assigned to predefined impact categories on a purely qualitative basis.
closed loop recycling\*
recycling of material within one and the same product system.
combined waste processing
a method of waste processing in which more than one form of waste is processed simultaneously.
comparative assertion\*
an environmental claim regarding the superiority or equivalence of one product relative to a competing product performing the same function; particular requirements are set by ISO on comparative assertions disclosed to the public.
completeness check\*
a step of the Interpretation phase to verify whether the information yielded by the preceding phases is adequate for drawing conclusions in accordance with the Goal and scope definition
consistency check\*
a step of the Interpretation phase to verify whether assumptions, methods and data have been applied consistently throughout the study and in accordance with the Goal and scope definition.
contribution analysis\*
a step of the Interpretation phase to assess the contributions of individual life cycle stages, (groups of) processes, environmental interventions and indicator results to the overall LCA result (e.g. as a percentage).
co-product\*
any of two or more functional flows from a co-production process.
co-production process
a unit process having more than one functional flow, e.g. crude oil refining.
critical review\*
an expert (internal or external) review of an LCA, designed to ensure validity, consistency, transparency and credibility of results.
damage approach
definition of category indicators close to areas of protection.
data category\*
a heading for classifying data in an LCA, e.g. energy inputs, raw material inputs, ancillary inputs, other physical inputs, products, emissions to air, emissions to water, emissions to land, other environmental aspects.
data quality\*
a data characteristic relevant for the capacity of the data to satisfy stated requirements.
data quality requirements\*
specification, in general terms, of the quality criteria to be satisfied by the data used in an LCA.
depletion
a decrease in the stock of a biotic or abiotic resource due to extraction thereof.
descriptive LCA (attributional LCA (ALCA))
a type of LCA focusing on the contribution of a particular way of fulfilling a certain function to the entire spectrum of environmental problems as they currently exist or are being created.
detailed LCA
the baseline LCA elaborated in this Guide, complying with the ISO 1404X standards and representative of studies typically requiring between 20 and 200 person-days of work.
difference analysis
a type of LCA focusing on the differences between two alternative product systems, thus ignoring those unit processes that are qualitatively and quantitatively identical.
economic flow
a flow of goods, materials, services, energy or waste from one unit process to another; with either a positive (e.g. steel, transportation) or zero/negative (e.g. waste) economic value.
economic process
→ unit process
economy-environment boundary
see also: system boundary
elementary flow\*
matter or energy entering or leaving the product system under study that has been extracted from the environment without previous human transformation (e.g. timber, water, iron ore, coal) or is emitted or discarded into the environment without subsequent human transformation (e.g. CO2 or noise emissions, wastes discarded in nature)
see also: environmental intervention
emission
a chemical or physical discharge (of a substance, heat, noise, etc.) into the environment, considered as an environmental intervention.
endpoint
→ category endpoint
endpoint approach
→ damage approach
environment system
the natural environment and its constituent processes.
environmental effect
→ environmental impact
environmental impact
a consequence of an environmental intervention in the environment system.
environmental intervention
a human intervention in the environment, either physical, chemical or biological; in particular resource extraction, emissions (incl. noise and heat) and land use; the term is thus broader than (‘elementary flow’).
environmental life cycle assessment \*
→ life cycle assessment
environmental mechanism \*
for a given impact category, the chain of environmental processes linking
interventions to impacts; modeled in LCA (usually only partially) to one or more category endpoints by means of a characterisation model.
environmental process
a physical, chemical or biological process in the environment system that is identified as part of the causal chain linking a particular environmental intervention to a particular impact, e.g. pollution leaching or bioaccumulation; for a given impact category, the environmental processes together form the environmental mechanism.
environmental profile
the overall result of the characterisation step: a table showing the indicator results for all the predefined impact categories, supplemented by any other relevant information.
environmental relevance \*
the degree of linkage between a category indicator and category endpoint
expert review\*
→ critical review
extraction
withdrawal of a biotic or abiotic resource from the environment in a unit process, considered as an environmental intervention.
final product
a product requiring no additional transformation prior to use
flow diagram
a graphic representation of the interlinked unit processes comprising the product system.
foreground system/process
a system or process for which primary, site-specific data are used in an LCA, for whatever reason.
format
a structured framework for representing and possibly processing unit process data as well as any relevant remarks.
function
a service provided by a product system or unit process
functional flow
any of the flows of a unit process that constitute its goal, viz. the product outflows of a production process and the waste inflows of a waste treatment process.
functional unit\*
the quantified function provided by the product system(s) under study, for use as a reference basis in an LCA, e.g. 1000 hours of light (adapted from ISO).
goal and scope definition \*
the first phase of an LCA, establishing the aim of the intended study, the functional unit, the reference flow, the product system(s) under study and the breadth and depth of the study in relation to this aim.
grouping \*
a step of Impact assessment in which impact categories are aggregated in one or more sets defined in the Goal and scope definition phase; it may take the form of sorting and/or ranking.
impact assessment \*
the third phase of an LCA, concerned with understanding and evaluating the magnitude and significance of the potential environmental impacts of the product system(s) under study.
impact category \*
a class representing environmental issues of concern to which environmental interventions are assigned, e.g. climate change, loss of biodiversity
impact score
→ indicator result
indicator result \*
the numerical result of the characterisation step for a particular impact category, e.g. 12 kg CO2-equivalents for climate change.
inflow
→ input
input
a product (goods, materials, energy and services), waste for treatment or environmental intervention (including resource extraction, land use, etc.) modeled as ‘entering’ a unit process (adapted from ISO)
interested party
→ stakeholder
intermediate product \*
An input or output from a unit process which undergoes further transformation before consumptive use.
interpretation \*
the fourth phase of an LCA, in which the results of the Inventory analysis and/or Impact assessment are interpreted in the light of the Goal and scope definition (e.g. by means of contribution, perturbation and uncertainty analysis, comparison with other studies) in order to draw up conclusions and recommendations.
intervention
→ environmental intervention
inventory analysis \*
the second phase of an LCA, in which the relevant inputs and outputs of the product system(s) under study throughout the life cycle are, as far as possible, compiled and quantified.
inventory table
the result of the Inventory analysis phase: a table showing all the environmental interventions associated with a product system, supplemented by any other relevant information (adapted from ISO).
land occupation
the unavailability of a given plot of land for alternative uses for a certain period of time.
land transformation
the change in the quality of a given plot of land due to a particular mode of human use, measured in terms of changes in biodiversity and life support functions.
LCA process
the integral series of exchanges among the individuals and organisations participating in an LCA project, from project initiation and guidance through to interpretation and discussion of the results.
LCA project
A project that seeks to obtain particular results by means of an LCA study and LCA process; besides commissioning parties and practitioners, it may also involve other organizations and individuals, in the capacity of data supplier, peer reviewer or interest group, for example.
LCA study
An environmental study in which LCA methodology is employed, performed by
practitioners who may or may not be affiliated to the party or parties commissioning the study.
life cycle \*
The consecutive, interlinked stages of a product system, from raw materials acquisition or natural resource extraction through to final waste disposal.
life cycle assessment (LCA)
Compilation and evaluation of the inputs, outputs and potential environmental impacts of a product system throughout its life cycle; the term may refer to either a procedural method or a specific study.
life cycle impact assessment \*
→ impact assessment
life cycle impact category indicator \*
→ category indicator
life cycle interpretation \*
→ interpretation
life cycle inventory analysis \*
→ inventory analysis
life cycle inventory analysis result \*
→ inventory table
life support functions
the ecological structures and processes that sustain the productivity, adaptability and capacity for renewal of lands, water and/or the biosphere as a whole.
marginal modeling
a type of modeling whereby changes in inputs and outputs are modeled on a marginal basis (e.g. full attribution to one additional train passenger of the extra power consumption required for transporting that passenger). Note: use of the word marginal is sometimes ambiguous; see section 1.2.3.4 of Part 3 for more details.
midpoint approach
→ problem-oriented approachengroMerijn Tinga
a unit process yielding more than one functional flow, e.g. co-production, combined waste processing, recycling.
multifunctionality and allocation \*
a step of the Inventory analysis in which the inventory model is refined and the input and output flows of multifunctional processes are partitioned to the functional flows of those processes.
natural resource
a biotic or abiotic resource that can be extracted from the environment in a unit process.
non-functional flow
any of the flows of a unit process that are not the goal of that process, viz. product inflows, waste outflows and environmental interventions.
normalisation \*
a step of Impact assessment in which the indicator results are expressed relative to well-defined reference information, e.g. relative to the indicator results for global interventions in 1995.
normalisation factor
the reciprocal of the indicator result for a particular impact category and reference system; used in the normalisation step.
normalisation result
→ normalised environmental profile
normalised environmental profile
the result of the normalisation step: a table showing the normalised indicator results for all the selected impact categories, supplemented by any other relevant information.
normalised indicator result
the numerical result of normalisation for a particular impact category, e.g. 0.02 yr for climate change.
open loop recycling \*
Recycling of material generated in one product system in a different product system.
optional extension
an option for enhancing the quality of a detailed LCA to address any obvious shortcomings.
outflow
→ output
output
an economic flow (e.g. energy, waste for treatment) or environmental intervention (e.g. pollutant or noise emission) modeled as ‘leaving’ a unit process (adapted from ISO)
perturbation analysis /ˌpɜːtəˈbeɪʃən/
a step of the Interpretation phase to identify any process data in which minor changes may significantly alter the inventory table, the (normalised) environmental profile or the weighting result, to identify efficient options for product improvement or to focus attention on sensitive items.
phase
any of the four basic elements of an LCA, viz. Goal and scope definition, Inventory analysis, Impact assessment and Interpretation.
pollution
a change in the state of the environment due to emissions.
practitioner \*
an individual group or organisation conducting an LCA.
primary function
the main function delivered by the product system under study.
problem-oriented approach
definition of category indicators close to environmental interventions.
procedure
the rules and arrangements adopted to manage an LCA study.
process
→ unit process
see also: environmental process
product
a positively valued economic flow of goods, materials, energy or services produced in a unit process and possibly serving as an input to another unit process.
product system \*
a set of unit processes interlinked by material, energy, product, waste or service flows and performing one or more defined functions.
proportional modeling
a type of modeling whereby changes in inputs and outputs are modeled proportionally (e.g. equal attribution to all passengers of the increase in power consumption needed for transporting one additional passenger). Note: use of the word proportional (and average) is sometimes ambiguous; see section 1.2.3.4 of Part 3 for more details
prospective LCA
→ change-oriented LCA
ranking \*
a grouping method whereby impact categories are hierarchically ranked (e.g. high, medium, and low priority), applying value choices.
recycling
a unit process, or set of processes, for collecting and/or treating waste from a unit process for useful application in the same or in a different product system (closed and open loop recycling, respectively).
reference flow
quantified flow generally connected to the use phase of a product system and representing one way (i.e. by a specific product alternative) of obtaining the functional unit.
release
→ emission
retrospective LCA
→ descriptive LCA
sensitivity and uncertainty analysis
a step of the Interpretation phase to assess the robustness of the overall LCA results with respect to variations and uncertainties in the methods and data used.
sensitivity check \*
an ISO step included in this Guide as part of sensitivity and uncertainty analysis.
simplified LCA
a simplified variety of detailed LCA conducted according to guidelines not in full compliance with the ISO 1404X standards and representative of studies typically requiring from 1 to 20 person-days of work.
sorting \*
a grouping method whereby impact categories are sorted on a nominal basis, e.g. by characteristics such as emissions and resource use, or global, regional and local spatial scales.
stakeholder \*
an individual group or organisation concerned about or affected by the environmental performance of a product system or the outcome of an LCA. Note: the LCA commissioner is also a stakeholder.
step
a discrete element of any of the four phases of an LCA; some steps (e.g. data format, calculation method) are areas of concern rather than actions.
subcategory
a subdivision of an impact category, e.g. freshwater aquatic ecotoxicity as a subcategory of ecotoxicity.
system boundary \*
the interface between a product system and the environment system or other product systems.
third party \*
a critical reviewer or a stakeholder other than the LCA commissioner or practitioner.
transparency \*
open, comprehensive and understandable presentation of information.
unit process \*
the smallest portion of a product system for which data are collected in an LCA.
use process
a unit process in which the final product is consumed, thereby delivering the function under study.
waste (for treatment)
An economic flow with a zero or negative value produced in a unit process and serving as an input to another unit process (note: materials such as waste paper and scrap metals with a positive economic, i.e. market value are thus not wastes but products) (adapted from ISO).
weighting \*
a step of Impact assessment in which the (normalised) indicator results for each impact category assessed are assigned numerical factors according to their relative importance, multiplied by these factors and possibly aggregated; weighting is based on value-choices (e.g. monetary values, standards, expert panel).
weighting factor
a factor obtained with a weighting method and used to express a particular (normalised) indicator result in terms of the common unit of the weighting result.
weighting profile \*
the result of the weighting step: a table showing all the weighting results, supplemented by any other relevant information.
weighting result
the numerical part of the result of weighting and aggregation of all (normalised) indicator results, e.g. 0.08 yr (note: the result may be expressed as more than one numerical value)
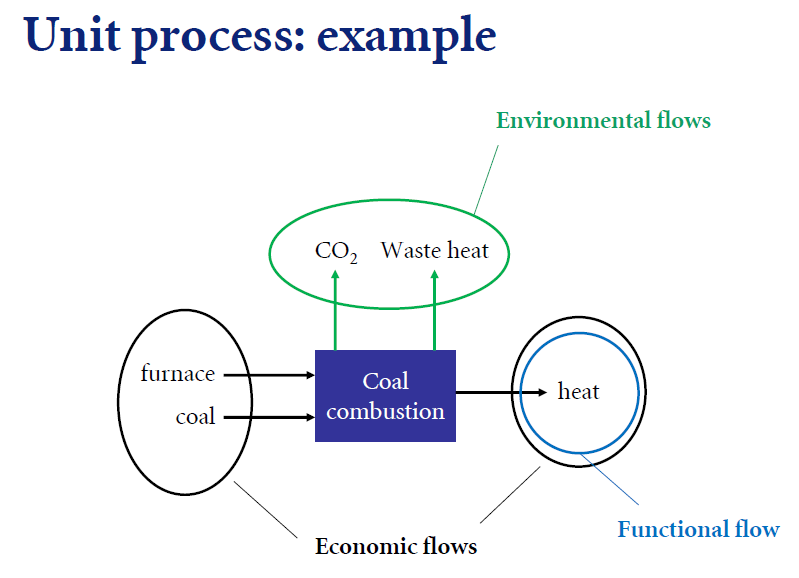
Figure 1: Basic structure of a unit process (or product system) in terms of its inputs and outputs.

Figure 2: Main sequence of phases and steps of an LCA, as set out in this Guide, showing respective results. Phases (in capitals) and steps (lower case) are shown as grey boxes, results as white ‘forms’. The dashed line around ‘weighting’ indicates that this is an optional step which according to ISO 14042 “shall not be used for comparative assertions disclosed to the public”.

3.2 Flowchart (flow diagram, foreground and background system/process, cut-offs…)

Flow diagram: a graphic representation of the interlinked unit processes comprising the product system.
Foreground system/process: a system or process for which primary, site-specific data are used in an LCA, for whatever reason.
Background system/process: a system or process for which secondary data, viz. databases, public references, estimated data based on input-output analysis, are used in an LCA.
Background processes: can also be depicted with arrows only (thus no boxes); the advantage is that diagrams get less cluttered; the disadvantage that the information on the producing activity is lost; the choice is yours; you do not need to report all inputs from background processes, but only those that are important for your system.
Fore- vs. Background systems: FG is what you model yourself (also when you adapt background processes); background processes are “untouched” from an LCI database.
Environmental flows: While these are part of unit processes, they are typically not shown in flowcharts.
Cut-offs: flows that are not considered in your system are described by entering or leaving the system boundaries. In addition to cut-offs also reference flows and co-products will leave the SB.
Multifunctionality: how co-products are dealt with does not need to be described at the level of the flowchart ( e.g. system expansion vs. allocation), but it is good to indicate such processes.
multifunctional process: a unit process yielding more than one functional flow, e.g. co-production, combined waste processing, recycling.
multifunctionality and allocation *: a step of the Inventory analysis in which the inventory model is refined and the input and output flows of multifunctional processes are partitioned to the functional flows of those processes.
3.3 Unit process

4. Goal and Scope Definition
4.1 ISO, GSD definition, and ALCA vs.CLCA
LCA: ISO definition
Compilation and evaluation of the inputs, outputs and the potential environmental impacts of a product system throughout its life cycle.
Unresolved discussion on 2 modes of LCA:
- attributional LCA (ALCA); impacts of current demand as it is (ceteris paribus) for the FU
- consequential LCA (CLCA); impacts as consequence of a change in demand for the FU
Attributional LCA (ALCA): to provide information on what portion of global burdens can be associated with a specific product life cycle.
Consequential LCA (CLCA): to provide information on the environmental burdens that occur, directly or indirectly, as a consequence of a decision (usually represented by changes in demand for a product).
Source: Section 1.5.2 of “Global Guidance Principles for Life Cycle Assessment Databases” (UNEP 2011)CLCA differs in two ways from ALCA (Weidema, 2003):
- co-product allocation is avoided by system expansion instead of applying allocation factors; and
- included processes are those which are expected to be affected by a change in demand, i.e. processes supplying the marginal product instead of processes supplying the average products used in ALCA models.
See also
Several other modes of LCA exist to model life-cycle impacts of possible future product systems (Guinée et al. 2018)
ALCA & CLCA may show (highly) different results for the same
product system- reason: (scenario-)assumptions !!
“[…] this article compares rapeseed oil and palm oil as a local and a global alternative for meeting the increasing demand for these products in the EU. By using detailed life cycle assessment (LCA), this study compares the environmental impacts and identifies alternative ways of producing rapeseed oil and palm oil to the EU market in order to reduce environmental impacts”. […] “Some, until recently, blind spots in agricultural LCAs are (1) the identification of the marginal/actually affected crops and regions, (2) the identification of how increased demand for an agricultural product is met and (3) avoided environmental interventions from transformation of non-productive land into agricultural land (Schmidt 2008a). Relating to (1), increased demand for rapeseed in the EU may lead to either increased import or increased cultivation or a combination. If cultivation is increased, it is important to clarify if this affects the area cultivated with other crops in the region. For example, in Denmark where the total agricultural area has been declining in the last decades, it is likely that increased cultivation of rapeseed will cause less area available for other crops. Thus, the marginal crop will be displaced. If it is assumed that increased production of rapeseed does not affect the overall food security in the world, the displaced crop will be compensated for in the region representing the marginal supplier of that crop. Relating to (2), it is relevant to clarify if increased agricultural production is met by increased yield or by increased area, i.e. transformation of non-productive land into agricultural land. This may include intermediate crop displacement; e.g. increased rapeseed in Denmark displaces barley; this ‘missing’ barley may be produced in Canada either by intensification or by expanding the agricultural land. […]”
— Source: JH Schmidt Int J Life Cycle Assess(15)2:183–197
4.1 Marginal suppliers of affected crops
…soybean meal as the marginal source of fodder protein and barley as the marginal source of fodder energy…
…the marginal suppliers of soybean meal and barley are Brazil and Canada, respectively.
…When soybean meal is displaced, the output of the dependant coproduct soybean oil is also affected. Market responses to that will most likely be a change in the production of the marginal vegetable oil, i.e. palm oil from Malaysia and Indonesia..
Carrying out the system expansion shows that increased demand for 1 t palm oil requires production of 1.001 t palm oil and the displacement of 2.45 kg soybean meal and 198 kg barley. The additional 0.001 t PO equals the displaced soybean oil which is co-produced with the 2.45 kg displaced soy meal. Correspondingly, increased demand for 1 t rapeseed oil requires the production of the 1 t rapeseed oil and the displacement of 1.045 t soybean meal and 157 kg barley, whilst additional 255 kg palm oil is required.
- However:
- main body of knowledge (“95-99%”) is exactly the same for ALCA and CLCA;
- our conviction that you can only learn and understand CLCA/ALCA if you first have good knowledge on LCA
- there are many more (scenario-based) modes of LCA;
- unclear as yet which questions are more appropriate for different modes of LCA;
- there is no superior approach;
- ……

Read more: Digesting the alphabet soup of LCA
Jeroen B. Guinée
The International Journal of Life Cycle Assessment, 2018
Backcasting LCA (BLCA), Decision LCA (DLCA), Integrated LCA (ILCA), Anticipatory LCA (NLCA), Prospective LCA (PLCA), Scenario-based LCA (SLCA).
Table 1 Examples of questions addressed by different modes of LCA
| Question | Reference | |
|---|---|---|
| ALCA | What is the life-cycle impact of 1 kWh of electricity at grid in France in 2006? | (Frischknecht and Stucki 2010) |
| BLCA | What is the maximum attainable affluence for the EU27 in 2020 and 2050 to meet related EU GHG target? | (Heijungs et al. 2014) |
| CLCA | What are the consequences of an increased demand of wheat in Denmark? Which effect does the decision to purchase an additional kWh of electricity have on the electricity market and/or on the environmental impacts? | (Schmidt 2010) (Frischknecht and Stucki 2010) |
| DLCA | Which effect does the decision to purchase an additional kWh of electricity have on the electricity market and/or on the environmental impacts? | (Frischknecht and Stucki 2010) |
| ILCA | What are the system-wide life-cycle impacts of a specific energy transition? | (Hertwich et al. 2014) |
| NLCA | What are the future environmental burdens associated with an emerging technology for both reasonable and extreme-case scenarios? | (Wender et al. 2014) |
| PLCA | What are the environmental benefits and impacts of nanosilver T-shirts compared with conventional T-shirts and T-shirts treated with triclosan? | (Walser et al. 2011) |
| SLCA | What is the best scenario for improving the life-cycle environmental performance of a car? | (Fukushima and Hirao 2002) |
Table 2 Key characteristics of modes of LCA
| Question addressed | Key method | Object of analysis | Scope | Other methods/models used | Allocation method | |||
|---|---|---|---|---|---|---|---|---|
| Temporal | Processes | Data | ||||||
| ALCA | What are the environmental impacts of a product system as it currently functions? | LCA | Commercially existing product system; as it is or was | Present, past | All | SDb | n.a. | Variable |
| BLCA | What is a region’s maximum attainable affluence to meet its planetary boundaries at time t with constant technologies and population? | IOA | Regional/global consumption; as it should be | Future, past | All sectors | Linear programming (LP) simplex algorithm | Variable | |
| CLCA | What are the consequences of an increased demand of a certain product system? | LCA | Commercially existing product system; as it changes due to a decision | Future | Marginal, market | SDb | CGEM; PGEM; IAM; LOM | Substitution |
| DLCA | What are the consequences of an increased demand of a certain product system? | LCA | Commercially existing product system; as it changes due to a decision | Future | Marginal, B2B | SDb | n.a. | Substitution |
| ILCA | What are the global life-cycle impacts of a specific energy transition? | LCA | Global energy consumption | Future | All | SDb and TI, B, IOA | IOA, IEA Blue Map scenario | Variable |
| NLCA | What are the expected environmental impacts of an emerging product system? | LCA | Emerging product system | Future | All | SDb and TI, F, B (optional) | Learning curves; technology and chemical models | Variable |
| PLCA | What are the expected environmental impacts of an emerging product system? | LCA | Emerging product system | Future | All | SDb and TI, F,B (optional) | Learning curves; technology and chemical models | Variable |
| SLCA | What are the expected environmental impacts of a certain future scenario of a product system? | LCA | Emerging product system | Dynamic, from past to future | All | Calculated | Life-cycle modeling language | Variable |
n.a. not applicable; product system (or technology system) a set of unit processes interlinked by material, energy, product, waste, or service flows and performing one or more defined functions (Guinée et al. 2002); SDb standard LCA data(bases), such as ecoinvent, GaBi, ILCD, and USDA; TI assumptions on technical improvements in key energy and material production technologies (Hertwich et al. 2014); F foreground processes; B background processes; CGEM computable and partial general equilibrium model; PGEM partial general equilibrium model; IAM integrated assessment model; LOM linear optimization model; All all processes included for supplying the functional unit; All sectors all industry sectors included for supplying the region’s/global consumption; Marginal processes actually affected by the decision; Market affected processes are determined by using market information and price elasticities; B2B affected processes are determined by factual or anticipated economic business-to-business relationship.
4.2 Goal definition


A hypothetical example:
The goal of the LCA is to identify options for improving the environmental performance of the material polyethylene in throwaway bags for bread. The results of this LCA will be used for product and process development. The plastic bag manufacturer wants to be able to analyse the effects of changes in their processes in terms of technology, inputs, and product composition on the total environmental impact. This information, in turn, can be used to prioritise different measures that can be taken to improve the environmental performance. This LCA does not aim at a public comparative assertion.
The study is performed by Pro-Duct Consultancy Ltd, a moderate-size private engineering bureau. The commissioner is Bag-Away, a large producer of plastic throwaway bags. Interested parties are mainly plastics industry, bakeries and shops. A steering committee with representatives from producer, ministry of environment and academia will be formed. Finally, an expert review will be carried out at NILCAR, the National Institute for LCA Research.
Is LCA the right tool?
What are the environmental impacts of farming fish in Vietnam in the Mekong Delta?
- Risk Assessment rather than LCA …?
What are the environmental impacts related to consuming fish species x cultivated in Viet Nam compared to the same fish species x cultivated in Thailand? - LCA rather than RA …?
4.3 Scope definition
ALCA or CLCA (or LCA)?
Detailed LCA?
Temporal coverage
Geographical coverage
Technology coverage
Coverage of processes
Coverage of interventions and impacts
Function, functional unit, alternatives and reference flows
You should include these Scope elements in your case study report!

- Detailed LCA (LCA Handbook, Part 3, p. 464-467):
- This is not defined by ISO but added in the LCA Handbook (Guinée et al. 2002) to determine the appropriate level of sophistication (simplified, detailed, …) of the LCA study in relation to its goal and application.
- Temporal coverage:
- The desired age of data (e.g. within the last five years) and the minimum length of time over which data should be collected (e.g. one year).
- Geographical coverage
- Geographical area from which data for unit processes should be collected to satisfy the goal of the study (e.g. local, regional, national, continental, global).
- Technology coverage
- Technology mix (e.g. weighted average of the actual process mix, best available technology or worst-operating unit).
- Coverage of economic processes (initial system boundaries):
- “Ideally, the product system should be modeled in such a manner that all the inputs and outputs at its boundary are environmental interventions. It is an iterative process to identify the inputs and outputs that should be traced to the environment, i.e. to identify which unit processes producing the inputs (or which unit processes receiving the outputs) should be included in the product system under study. The initial identification is made using available data. Inputs and outputs should be more fully identified after additional data are collected during the course of the study, and then subjected to a sensitivity analysis.”
- Coverage of elementary flows (environmental interventions) and impact categories:
- “It shall be determined which impact categories, category indicators and characterization models are included within the LCA study. The selection of impact categories, category indicators and characterization models used in the LCIA methodology shall be consistent with the goal of the study”.
- Special case of “coverage of processes”:
- Exclude life cycle stages or subsystems that are qualitatively and quantitatively similar for each of the (product) systems analysed.
- Only if focus is on assessing differences between alternative (product) systems.
- Example: if filling and distribution processes for, e.g., two types of beverage bottles are exactly same.
Scope definition: example
“The LCA is carried out to identify hot spots for improvement of processes in the Netherlands, therefore data should be representative of the present state of technology in that country. In this study, we used the most recent data that were available, mainly from 1999.
We have adopted an attributional approach, which may later be extended to a consequential
approach. For the goal of the study simplified guidelines will suffice for most steps.
Total size of the study is 8 man-months. A large amount of this time will be devoted to the collection of representative data of the most important production, recycling and upgrading processes.”
4.4 Function, functional unit, and reference flow
4.4.1 Function
- A service provided by a product system or unit process, e.g. lighting, transport, enjoying a film, nourishment, etc.
- Or better and more specific: lighting a room of X m2 with light of 1250 lumen
- Etc.
4.4.2 Functional unit
- The quantified function provided by the product system(s) under study for use as a reference basis in an LCA, e.g. 1000 hours of light (of 1250 lumen)
- Adapted from ISO
- Original ISO 14040 definition: “quantified performance of a product system for use as a reference unit”
4.4.3 Generic or strict FU
- The more strictly the functional unit is described, the fewer alternatives will be left to compare …
- The functional unit ‘watching TV for 1 hour’ may be specified to include more and more functions, as in ‘watching colour TV for 1 hour’, ‘watching 55 inch screen
colour TV for 1 hour’, ‘watching 55 inch screen colour TV with remote control for 1
hour’, etc.,
- … until there are no product alternatives left to compare.
4.4.4 Reference flows
- Definition:
- “quantified flow generally connected to the use phase of a product system and representing one way of obtaining the functional unit”
- Ref. flow = FU + specific product alternative supplying FU
- Examples (FU “1000 hours light of 1250 lumen” can be supplied by several different reference flows):
- 1000 hours tube light of 1250 lumen
- 1000 hours fluorescent light of 1250 lumen
- 1000 hours incandescent light of 1250 lumen
- 1000 hours LED light of 1250 lumen
Schematically
focusing on fluorescent and incandescent lamp for reasons of space …
function: lighting a (specific) room
functional unit: 1000 hours of light
alternatives: incandescent lamp and fluorescent lamp
reference flow for system 1: 1000 hours of light with an incandescent lamp
reference flow for system 2: 1000 hours of light with a fluorescent lamp

More examples
Functional unit:
- 1 l of orange juice at the point of sale
Reference flows:
- 1 l of orange juice at the point of sale adopting PEF technology;
- 1 l of orange juice at the point of sale adopting NFC technology;
- 1 l of orange juice at the point of sale adopting FS technology.
Functional unit:
- Colouring 20 m2 of wall type X with opacity 98% and durability of 5 years
Reference flows:
- Colouring 20 m2 of wall type X with
opacity 98% and durability of 5
years using paint A; - Colouring 20 m2 of wall type X with
opacity 98% and durability of 5
years using paint B; - Colouring 20 m2 of wall type X with
opacity 98% and durability of 5
years using paint C.
- Colouring 20 m2 of wall type X with
CMLCA®
- Just for tomorrow afternoon and for your case study:
In CMLCA software the reference flow is the “Alternative”.
Lessons learned
- Provide a ‘function’
- FU = ‘function’ + quantification: don’t forget either one
- Reference flow = FU + alternative
- Define as many separate reference flows as you have alternatives.
- Formulate consistently throughout ‘function’, ‘functional unit’, and ‘reference flows’
The above poses a nice metaphor to some of the existing LCA so far : very exact answers are given to imprecise or vague questions.
5. Exercise on Function, FU, Alternatives and Reference flows
Exercise on Function, FU, Alternatives and Reference flows.
Exercise:
(work in virtual groups or do this exercise on your own for all items listed below):
- What is the function of;
- What is an appropriate FU for;
- What are the alternatives; and
- What are the reference flows for:
5.1 Providing coal-, oil- or wind-based electricity.
Function:
- to provide electricity to the grid
- Energy supply
- Lighting
- ……..
Functional unit:
- to provide elect to 100 Dutch households at peak hr for 1 yr
- to provide 1 kWh electricity to your home … in the night time … ac dc, peak …, efficiency %, in NL/DLD/…,
- kWh
- ……
Alternatives:
- Coal comb/ horizontal wind turb./oil
Reference flows:
- coal to provide elect to 100NL houses at peak hr for 1 yr
- to provide 1 kWh electricity to your home … in the night time … ac/dc, peak …, efficiency %, in NL/DLD/…, by coal power plant; etc.
- Diff of producing lighting from coal/wind/oil
Impact of Coal/oil/wind to produce x kWh
NO! Impact is not the function but the environmental consequence …
- ….
5.2 Using one-way or reusable beverage containers
- Function:
- Containing
1L ofwater - Providing portable liquid
- to supply certain volume of beverage, … in 1.5 litre bottles, … transported from supermarket to your home, …
Contain and maintain milk
- Containing
- Functional unit:
- Containing 1L of water
through distribution system, 10 times - Providing portable liq. 1 week
- 1 liter of beverage transported from supermarket to your home
- 1L milk
- Containing 1L of water
- Alternatives:
- disposable carton container, reusable glass
- Disposable vs reusable
- one-way, reusable
- tetrapak, plasti
- Reference flows:
- containing 1L of water through distribution system for 10times with carton/glass
- containing liq for 1 wk by X, X
- 1 liter of beverage transported from supermarket to your home by cardboard bottle system, …. glass bottle; one-way glass bottle, one-way cardboard bottle, reusable cardboard bottle, reusable glass bottle
- 1L of milk in tetrapak/plastic
5.3 Consuming traditional or organic potatoes
- Function:
- providing a calorific amount of potatoes grown in the NL to the Dutch market
- Consumption of potatoes grown in the NL
- food/nourishment; providing energy; nutritional value; potato tasting food
- Functional unit:
- Providing 500cal of potatoes grown in the NL
- Consumption of 1 serving of potatoes grown in the NL
- to supply 1 kg of potatoes to your home; fulfilling dietary needs of 1 kg of calories; kcalories; recommended daily intake
- Alternatives:
- Organic and traditional
- Reference flows:
- Providing 500cal of organic/traditional potatoes grown in the NL
- Consumption of 1 serving of organic/traditional potatoes grown in the NL
- to supply 1 kg of organically/traditionally cultivated potatoes to your home, … etc.
5.4 Communicating by paper, telephone, or e-mail
Function:
- Transmitting information
- Story telling
- Transmitting data from NL to …
- …..
- Functional unit:
- transmitting information in 1000 words to 1000 people
- to provide story x to person y
- Transmitting 100 kb of data from NL to …
- ….
- Alternatives:
- Email, telephone, paper, sms, ….
- Reference flows:
- Transmitting info in in 1000 words to 1000 people by email/paper/…
- to provide story x to person y by paper/telephone/e-mail (PC, tablet, phone,…)
- Transmitting 100 kb of data from NL to … with telephone/email/paper
- ……
6. Inventory analysis
“Phase of life cycle assessment involving the compilation and quantification of inputs and outputs, for a given product system throughout its life cycle” [ISO 14040]
Steps involved:
- Refining of system boundaries / determination of cut offs
- Drawing a flow chart / product system
- Collecting unit process data
- Dealing with multi functional processes
- Calculating the life cycle inventory analysis result
Goal: to determine the environmental flows related to a
product system (Life Cycle Inventory)

6.1 Economic and environmental flows and the economy environment system boundary
Economic vs. environmental flows
Economic flows: Products, services, and wastes produced and managed by humans. For example: steel, electricity, and wastewater
Environmental flows: 1) Flows entering the product system without prior human transformation , e. land use, freshwater use, metal extraction all resource extraction. 2) Flows leaving the product system without subsequent human transformation , e.g.: emissions (air, soil, water)
6.2 Unit processes
“smallest element considered in the life cycle inventory analysis for which input and output data are quantified”

6.3 Cut-offs
Cut offs and system boundaries
Rule: Each economic input or output of a unit process should be followed until it has been translated into environmental flows ( e.g. resource extractions and emissions)
Examples:
TV -> transformer -> copper wire -> copper -> copper ore
TV -> electricity -> coal, gas, etc.
TV -> electronic equipment waste -> removal of precious and recyclable materials -> dump site -> toxins
The System Boundary is the demarcation between what is included in the product system and what is excluded (cut off).

- Practical constraints: Lack of data, time/funds
- Ignorance: We may not be aware of certain process inputs/outputs
- Predefined criteria
- Purpose/motivation of study or leverage of commissioner: e.g. water flows not included
- Difference analysis: we may leave out certain parts of a system as it is the same for all compared alternatives.
Common system boundaries / cut offs
Example: T shirt

“The principles of system boundary definition are decided during the GSD. However , one may have to wait to decide the exact details until enough information has been collected during inventory analysis”[Hitchhikers guide, page 79]
6.4 Flow diagrams
What is it?
- Simplified graphical representation of a product system
- Showing interdependence of economic processes
Why do we need it?
- Useful for modeling a product system
- Great communication tool showing others what your LCA is about
Constructing a flow diagram is a “cumulative and iterative process with revisions and elaboration as more is learned about the modelled system […]”
[Hitchhikers guide to LCA: p98]
In reality, supply chains are complex ….


Flow diagram checklist
- Show system boundaries
- Unit processes (boxes)
- Economic flows (arrows) No environmental flows
- Distinguish between foreground & background
- Show cutoffs
- Reference flow crossing the system boundary
- Legend
- No numbers
- Is it legible? /ˈledʒəbəl/

6.5 Data collection and reporting
Data Collection
Incremental steps.
Start with main components, THEN add detail.
LCAs require attention to detail AND the bigger picture.
Format and data categories (1)
Central entity in LCA: “Unit process”
General considerations:
- processes have inputs and outputs
- processes have economic flows and environmental/elementary flows
- several types of each (e.g., materials, energy, atmospheric emissions)
- symmetry in economic flows (output of one process is input of another process)
Unit process
“smallest element considered in the life cycle inventory analysis for which input and output data are quantified”

Data sources
Primary data:
- measurements
- stoichiometric calculation /ˌstɔikiə’metrik/化学当量的;化学计算的
- expert interviews
Secondary data:
- (scientific) literature
- reports
- LCI databases for basic processes and materials (e.g. ecoinvent)
What if we don’t have primary /
secondary data?
Possible solutions:
- Background (database)
- Provide estimations Proxies
- Omitting mass flows < 1 or 5%, (but check if they could be environmentally relevant, e.g. rare earths)
i.e. Cut off certain flows (Last resource OK as starting point). Report the influence/existence/justification of cut offs.

molecular /məˈlekjələ $ -ər/, stoichiometry/ˌstɒɪkɪ’ɒmɪtrɪ/ n. 化学计算(法);化学计量学
Data quality
Crucial to address data quality
- precision
- completeness
- representativeness (temporal, geographical, technology)
- consistency
- reproducibility
No standardised method for overall assessment of data
quality available (Pedigree matrix used in ecoinvent to quantify uncertainty /‘pedɪgriː/).
- Report: Assumptions, Calculations (equations, units), and Modifications to database.
- Keep a logbook/ Excel (reproducible results).
Unit process data reporting
Example
Best report unit process data similar to this. One table per unit process you model (either in Inventory Analysis section or Appendix of your report).
Inventory table (or LCI = life cycle inventory)
List of all physical interactions between a product system and the environment.


Calculation of LCI analysis results
Relating unit processes to reference flow(s)
- Based on linear scaling of processes
You never need to scale your product system manually! The computer does this for you…
- Matrix algebra solution available
- Take account for (feedback) loops
Calculation only works, if:
- One unique supplier for every product
- Multi functionality is resolved
6.6 Data pitfalls
- Errors are easily introduced …
- errors in measurements
- errors in data entry
- errors with units (litre versus gallon)
- errors with prefixes (mg versus mcg)
- errors with nomenclature (N2O versus NO2)
- … and can sometimes easily be detected
- comparative analysis of different data sources
- mass and energy balances
- Recycling
Missing data: blank, “99”, “0”, “#N/A”.
Notation: thousands separator, keyboard settings.
Units: SI units (m, kg, s, K)
Prefixes:
Significant digits : don’t claim to be more precise than you are able to
6.7 Exercise
Function: providing electricity
Functional unit: producing 1kWh of electricity
Alternatives: coal, oil and wind
Resource flows: producing 1kWh of electricity from oil
producing 1kWh of electricity from coal
producing 1kWh of electricity from wind
could include proper specification low Vol etc, location, (temporal scope), seasonal specification
Function: packaging beverage => contain and maintain beverage
Functional unit: packaging 1 litre of X
Alternatives: reusable beverage container, one-way beverage containers
Resource flows: packaging 1 litre of X in a reusable container
Packaging 1 litre of X in a one-way container
Packaging here is very specific -> what is the function? Containing instead!
Function: consumption of potatoes grown in the NL
Functional unit: consumption of 1kg of potatoes grown in the NL
Alternatives: organic, traditional
Resource flows:
Function: exchanging information
Functional unit: 500 words of information to 1000 people for a specific distance? Instant paper? Then what about paper?
Alternatives: email, telephone, paper, sms
Resource flows: transmitting info in 500 words to 1000 people by email/…
A. What would be an appropriate function and functional unit for a comparison involving more types of lighting options?
Function: lighting
Functional unit: 1000 hours of lighting
B. Define the appropriate (more appropriate than the working-definition provided below) reference flow based on your functional unit for the system depicted above.
Resource flow: 1000 hours of lighting with light of 450 lumen LED light bulb in NL.
C. Redraw the process flow diagram, while omitting the ‘Glass manufacturing’ and ‘Waste disposal’ processes and without connecting to other processes (!!). Do this by drawing the remaining 3 processes as rectangles, then draw the arrows for inflows and outflow for each of the 3 processes (economic flows in vertical direction; environmental flows in horizontal direction) according to the specifications in the above table (but, as said, without connecting to other processes!!). Then insert the quantitative data from the table above next to each of the flows.
| Product | Outflow | Energy content (GJ) | Allocation factor F1 |
|---|---|---|---|
| Electric power | 500 kWh | 2 | 0.4 |
| Steam | 1000 kg | 3 | 0.6 |
| Total | 1 |
Electric power 4MJ/kWh electric power
Steam 3 MJ/kg steam
| Environmental outflow | unit | Quantity allocated to 500 kWh | electric power Quantity allocated to 1000 kg steam |
|---|---|---|---|
| CO2 | Kg | 400*0.4 = 160 | 240 |
| CH4 | Kg | 6*0.4 = 2.4 | 3.6 |
| N2O | Kg | 0.005*0.4 = 0.002 | 0.003 |
F. Now redraw the process flow diagram from assignment C, replacing the quantitative process data for ‘Power generation (using Cogeneration)’ by the quantities you have allocated to 500 kWh electric power in assignment E.
G. Calculate the scaling factors for the 3 processes. Scaling factors represent the fraction of the process that is needed to fulfil the functional unit defined. Note that you should use the flow diagram you drew in assignment F (including process data of the first Table) to determine how the scaling factor for the process of ‘Using the light bulb’ affects the other processes. Start from the functional unit, determining the reference flow from the use process, etc.
H. Fill in the ‘inventory table’ below. Inventory table for 1000 hours of light (from a 450 Lumen LED light bulb)
I. You can calculate the ‘climate change indicator’ result by multiplying the greenhouse gas emissions by their respective GWPs. Fill in the result in the table below.
J. Which emission from which process contributes most to the result for the climate change indicator?
CO2 emissions from power production
7. CMLCA introduction
7.1 Introduction to CMLCA software
CMLCA and corresponding documentation is available at our separate www.cmlca.eu website. For the LCA-PR course we use the CMLCA version that is available through the Blackboard page of the course.
On the other hand, it is developed with the principles of LCA, IOA, etc. in mind, so that it is quite accurate and up-to-date as to methodological details. It is, for example, fully based on matrix algebra, although the user may be unaware of that whilst using the program. This implies that process trees with a recursive flow structures (steel production needing coal and coal production needing steel), provide no computational problems and are exactly solved. Moreover, the program is very flexible in dealing with allocation of multiple processes. In contrast with some other programs, such processes need not be allocated prior to their entry in the database, and the allocation method (substitution, partitioning, or no allocation at all) may be defined for each individual unit process. The program also supports fully hybrid inventories, consisting of process-based and IO-based data. It is rich in its analytical possibilities.
7.2 Exercises using CMLCA and ecoinvent
CMLCA: Scientific software for LCA, IOA, EIOA and more
- Intended to support the technical steps of LCA
- Doesn’t support procedural aspects, like peer review, etc.
- Assumption: user is aware of basic LCA principles
- Just one of many software tools that are available
- Its philosophy is probably somewhat different
- The program develops continuously
- Available through the MST “CMLCA download” channel
and http://cmlca.eu/cmlca61.zip- Also see the CMLCA pdf file in the same channel for more info
7.3 7 reasons for using CMLCA
- free
- flexible
- perfect for use in class room
- perfect for use by scientists
- compatible with ISO framework and terminology
- does not require an administrator for installation & can be transferred online
- Advanced settings
7.4 7 reasons for not using CMLCA
- has no helpdesk
- contains no process data (but we will import ecoinvent)
- contains no impact assessment data (“but we will import these with you”)
- not so good for consultants
- no graphical interface for constructing flow diagrams
- only available in English
- only available for Windows (!!) (but there is a CMLCA-FAQ including “Mac-problems” in the MST “CMLCA download” channel; see “CMLCA Troubleshooting and FAQs.pdf” )
8. Case study brainstorm session and topics database
8.1 Reflect on a possible topic
Given the case study requirements, think of a topic (either your own or from the list of previous topics) and elaborate, briefly:
- Establish relevance. Why should we care about the topic?
- Justify the use of LCA for the case study. Why is it necessary to evaluate life cycles?
- What’s the comparison
Helpful to think about the following when selecting a topic
- WHY: Relevance and LCA justification
- HOW: How you may approach this (scope)
- WHAT: what may you obtain from results
- Single use vs reusable
- Bio vs fossil
- Local vs foreign
- … others?
- Make sure to involve a comparison
- Keep it simple; learning LCA is already challenging enough!
For example: cloud vs HD storage, Spotify vs CDs, is too abstract and lacks clear boundaries (e.g., what is the Spotify system and where does it stop? Before you know you need to model all servers behind this system which is practically not feasible)
- Do select an ‘easy topic’!
- Don’t do an LCA on a waste management system: too
complex!! - Don’t do a case for a commissioner:
- you won’t often get the data needed, even when ‘promised’ …..
- LCA-PR case study results are too uncertain
- the course is about learning LCA, and that’s already challenging enough.
8.2 Previous case-study topics
- Almond vs Dairy milk
- Bamboo vs oak flooring
- Plastic bags or a lunchbox for your lunch
- Closed- vs open-loop hydroponics
- Using pig manure to power pig farms in Taiwan
- E-reader vs paper book
- Importing tomatoes from Spain or growing in NL
- Olive oil production in Turkey or Greece?
- Waste management options in Bangladesh
- Plastic bottles vs cans
- Newspaper waste management
- Using cotton or nylon for clothing
- Led bulbs vs incandescent bulbs
- Couscous vs Quinoa
- Genuine vs synthetic leather
- Sheep wool vs acrylic wool
- Fresh vs canned pineapple
- Honey vs sugar as a sweetener
- Textile dying with supercritical CO2
- Filter drip vs instant coffee
- Clay bricks vs sand-lime bricks
- Copper telluride production
- Cooking on gas or cooking on electricity
- Beer vs wine
- Bio-composites
- Plastic vs metal cutlery
- LCA of textiles: cotton vs. nylon /’naɪlɒn/
- 2nd Generation Nest Learning Thermostat and the Honeywell Round CT-87N /ˈθɜːməstæt/
- a cup of filter drip coffee compared to a cup of freeze dried instant coffee
- Advancing sustainable urban farming: a comparative LCA of aquaponics vs. aeroponics
- Almond Milk or Dairy Milk /‘ɑːmənd//‘deərɪ/
- animal feed from food waste as compared to producing animal feed from grains
- Are glasses more sustainable or contact lenses, a case study of LCA
- Ballpoint pen versus fountain pen
- bamboo versus cotton clothing
- Beef and Chicken Meat in the Netherlands
- beef burger and a soy based burger
- biodiesel production from two available feedstocks in Mexico: CLORELLA VULGARIS & JATROPHA CURCAS
- Bottled versus tapped water at festivals
- Butter and Margarine
- BUTTER versus olive oil for frying
- cashew nuts and chicken fillet /‘kæʃuː/
- Cement production
- Ceramic mug compared to a plastic cup /sɪ’ræmɪk/
- Ceramic plates or paper plates?
- Chicken vs Mealworm protein production
- Chalkboard vs. whiteboard
- clay brick or sand-lime brick in Indonesia
- Horticulture tomatoes in the Netherlands
- Cocaine Production in Colombia to supply for the European Market
- Colombian bananas: Organic vs. Conventional Production systems
- Comparative LCA of copper telluride production
- Comparative LCA on constructing a tower from ABS LEGO bricks vs. cherry wooden Eco-Bricks
- Comparative LCA study of wooden and cellulose-acetate spectacle frames
- Comparative Life Cycle Assessment of NiMH and Li-Ion Batteries in Electric Vehicles
- Comparative life cycle assessment of two steak dinner alternatives
- Comparing Capsule, Pod and Drip Filter Coffee
- comparison of microalgae culture coupled to biodiesel and biogas production
- Concrete and asphalt pavements /‘æsfɔlt/沥青
- Conventional versus organic beef
- Conventional versus organic milk
- Cooking on gas versus cooking on electricity
- Copper cathode production technologies
- Dishwasher versus Hand-washing
- Dopper versus PET-bottle
- dried pulses versus canned pulses
- drought lager beer and white wine
- Dutch- and Spanish tomatoes sold in the Netherlands
- Dutch greenhouse operation heated by CHP and geothermal doublets
- Egg consumption in the Netherlands
- Electric and Conventional Car Use in Different European Countries
- Electricity from wind turbines in the Netherlands located offshore vs. onshore
- E-reader v. Conventional Paperback Novel
- espresso served by a Nespresso versus semi-automatic espresso machine
- feeding a cow with silage maize from Industrial Production and Organic Production in Switzerland
- Flax Fibre and Cellulose Fibre Insulation in Finland
- Flax fibre-epoxy composite versus Glass fibre-epoxy composite
- Fresh (CR) & Canned (PH) Pineapple
- Fresh mango or frozen mango
- fruit as a source of sulphur
- Genuine and Synthetic Leather
- Hand-drying system in China: Fold Tissue Towels vs. Cotton Roller Towels
- HDPE and steel drums as containers of chemical goods
- HDPE vs. organic cotton bags
- Honey or Sugar?
- Insectmeal vs. soymeal
- LCA of a T-shirt made of cotton and polyester in China
- LCA of avocado production at Michoacan, Mexico. A study case of organic vs. traditional avocados for local and
- LCA of batteries for household use
- LCA of beer
- LCA of biogas production from pig manure in Taiwan
- LCA of chrome-tanned and vegetable-tanned leather production in Italy
- LCA of electric bike
- LCA of municipal solid waste management in Chittagong, Bangladesh
- LCA of selected technologies for CCS of coal fired plants
- LCA on Isolating Existing pre-1970 dwellings in the Netherlands
- LCA on the use of olive oil
- Life Cycle assessment of HDPE and paper bags in Europe
- Locally produced grazing cattle milk vs. industrially manufactured soymilk in the Netherlands
- Management of the Organic Fraction of Municipal Solid Waste in South and Southeast Asia
- Mokumono Bicycles vs. “The conventional bike”
- Natural and synthetic dyed textiles: Cotton and polyester curtains
- natural-color sheep wool versus acrylic wool /əˈkrɪlɪk/ 丙烯酸
- open-loop versus closed-loop hydroponics
- Organic and Conventional Coffee Production
- organic versus conventional meat
- Paper waste treatment in the Netherlands: incineration vs recycling
- PE plastic and stainless steel cutlery
- Pineapple leather and Bovine leather
- Plant factory
- Plastic bag versus plastic lunchbox
- Small scale batch roasting of organic coffee beans versus large scale continuous roasting of inorganic coffee be
- Soy versus beef burgers
- tampon and menstrual cup
- Textile dyeing with supercritical carbon dioxide
- The environmental benefits of locally produced surfboards: an ECO surfboard case study
- Tofu versus beef on protein content
- Tomatoes in the Dutch supermarket
- Traditional Bullets and “Green” Bullets
- Traditional flashlight versus a solar light for recreational purposes (wakawaka)
- Train ticket & OV- chipcard
- T-shirts made with Organic and Traditionally grown Cotton
- Using of Bamboo as an Alternative to Red Oak Flooring
- Vertical farming and open field lettuce cultivation, a comparative LCA study
- vinyl record (LP) and CDs
- water based paint and wallpaper covered by PVC
- Water Supply Options for Mining Operations in Chile
- Wheat and barley in producing flour
- Which chickpeas should I buy?
- wine from Napa Valley (USA) versus French Bordeaux wine /bɔ:‘dəu/
- wood and PVC window frames
- Yogi Tea and Lipton
9. LCI databases and ecoinvent
9.1 LCI database
What is an LCI database- A collection of datasets describing the inputs and outputs of economic activities
- E.g. material and energy flows , emissions , wastes
- And meta data process descriptions , modeling and
assumptions , data sources and quality , uncertainties , etc
- Main purpose : to provide « background data » to support LCA studies
- our economies are too complex for collecting such data from scratch for every LCA study
Existing LCI databases
General purpose
- Ecoinvent (non for profit)
- GaBi sphera
- USLCI database (US) and ELCD database (EU
- Japanese , Chinese, Thai, Specific applications
- World Food LCI Database
- Agribalyse (French)
- …
- … many specialized databases (e.g. construction, carbon footprinting , water footprinting)
Overview of existing datases
https://nexus.openlca.org/databases
https://www.globallcadataaccess.org
- Coverage of activities
- Completeness of description
- Transparency e.g. unit processes
- Documentation e.g. activity descriptions
- Data quality guidelines consistency
- Peer review
- Regularly updates
9.2 Introduction ecoinvent
9.2.1 What is ecoinvent?
- ecoinvent is a non-for-profit association initially created by a network of Swiss research institutes
- ecoinvent publishes the ecoinvent database
- Goal: to publish useful and relevant life cycle inventory data in a centrally organized form
- Origin in the 1990s (common need for background data)
- Small, loosely connected pools of data
- Unified database versions
- Version 1 published in 2003
- version 2 in 2008
- Version 3 in 2013 (now yearly updates, currently 3.7)
- Version 3.7: around 20000 datasets
- 4 System models for different application scenarios
- Unit processes, aggregated LCIs, LCIA results
- ecospold2 is the main data format
- Used by more than 6000 users in more than 40 countries (figure probably outdated…)
- Included in or available for the leading LCA and eco design software tools
- the database is used in many software tools, such as (and many more)

9.2.2 Data in ecoinvent
- v2.2: ~4000 inventories, V3: ~10000 inventories
- New electricity data in v3: 90% produced electricity in the world
- New data added to version 3.01: Passenger transport (road), Biofuels, Fruits and veggies, Chemicals, and Building materials, Freight transport by road, Wood sector: forestry, machinery, wood based products, wood preservation.
- New data added to version 3.1: Aluminium supply chain, Cardboard, New tap water production activities
in GLO, Québec, CH, Europe, Incineration
Heat production, Dairy; Soja derivatives - New in ecoinvent v3.2: Complete update of the whole electricity sector (We are chopping China!), Refrigerated transport, Wood production, Aluminium, Clinker , cement , concrete, Agricultural production, many more…
- New in 3.5: over 2'000 datasets on aquaculture and fish capture, waste treatment, aluminium, hard coal, pulp and containerboard
- New in 3.6: …2,200 new and 2,500 updated datasets …
9.2.3 Licence
You may ONLY use the ecoinvent database provided to you in this course within the context of this course and as long as you are a student at Leiden University or Leiden University College.
(LUCML, ecoV3JG62,0)
9.2.4 Geographies
For example, Switzerland has the abbreviation CH, Czechia is CZ and China is CN.
Almost every activity in the database is also represented at the global level, using geographical location global (GLO) or Rest-of-the-World (RoW), representing the average global production.
Geographies for the same activity cannot overlap. For example, an activity from Switzerland cannot coexist with the same activity at the European (RER) level since Switzerland is contained within RER. Therefore, geographies such as “Europe without Switzerland” are created. Full and partial overlaps are reported in the geography file.
Example calculation of the Rest of the World
Let us assume an activity is available for four different regions: the United States (US), India (IN), China (CN), and Global (GLO).
During the linking, the RoW production is generated as a copy of the global dataset. The production volume (PV) of the RoW activity is calculated by subtracting the production volume of the regional activities from the global volume:
PV RoW = PV GLO – PV US – PV IN – PV CN
In supply chains, the newly generated RoW process connects to other processes with overlapping geographical boundaries.
9.3 Activities (Ecoinvent)
Definition of Activity- An Activity is a unit process that represents a human activity and its exchanges with the environment and with the products of other human activities (Technosphere).
- We’ll focus on technosphere exchanges from now on.

- Activities when unallocated may produce two types of products:
- Reference product : the reason for carrying out this activity
- By product / waste : any other output of the activity (These definitions differ from those used in this course (good and waste) although this should not be of consequence for you

Types of activities: overview
9.3.1 Transforming activities
Transforming activities are human activities that transform inputs, so that the output of the activity is different from the inputs

The same activity name, different geography
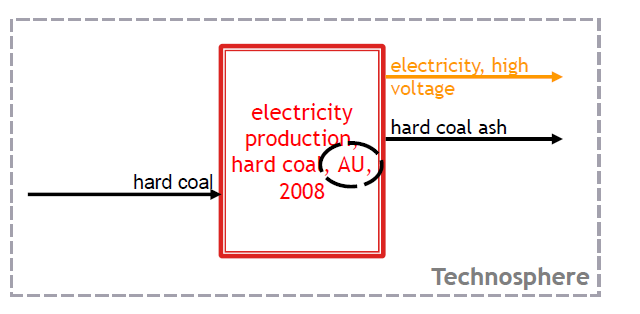
The same reference product, but different technology

The same reference product, but different technology (and thus potentially also different by products)

9.3.2 Transfering activities (markets)
Market activities are consumption mixes.
They provide products from producing activities to the consuming activities that use them an inputs.

They add information to the consumption mix:
- Default information relative to the transport of the product
- Information about losses

- Markets for same product can have different geographical locations
- If the location is not GLO (global), we call them regional markets

- There are two basic types of activities in the database: transforming and transferring activities
- Transforming activities are production or treatment processes
- Transferring activities are markets
- Market activities are consumption mixes and account
also for transport and losses
9.3.3 Treatment activities and markets
Treatment activities- A transforming activity with a reference product with a negative sign
- A treatment activity “treats” (e.g. disposes) a given product

- They also exist for wastes:
- Representing the consumption mix of the waste treatment
- Bearing as well default transport information

Another type of transforming
activity: treatment activities
Waste from a waste producer to a
treatment activity
Generation of consumption mixes of wastes
Consumption mix market generation and use follow same rules as described
- based on geography
- based on product name (different technologies, same market)
- using production volumes to define market shares

Note that the same system looks like this if the arrows are flipped

- The negative signs allow to maintain the mass balance in the activities
- As with regular products, markets are used to model geographically constrained consumption mixes
- For example: MSW from different producers goes to the market for MSW and from there to different treatment processes (representing the share of treatment processes in a given region)
Negative inputs are the same as positive outputs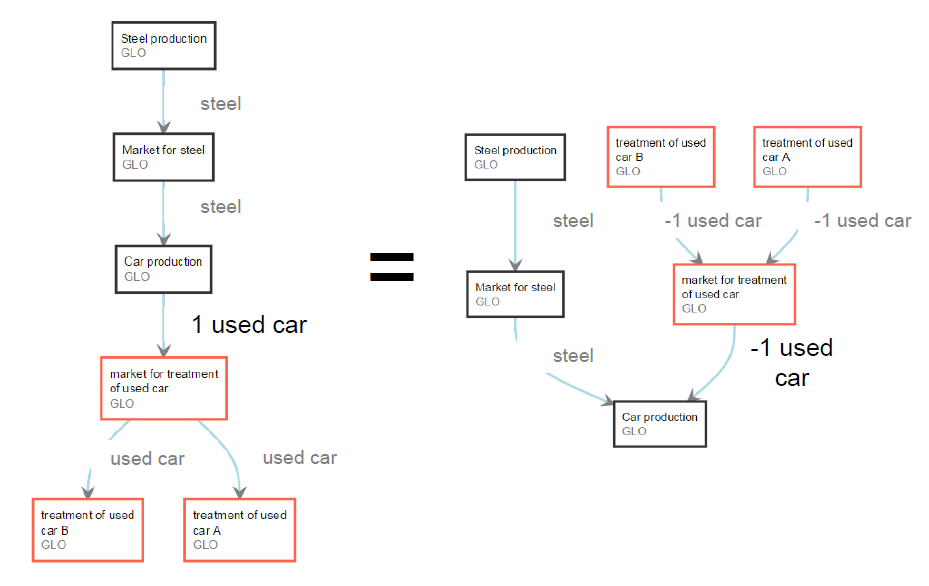
Ecoinvent way
CML way
- Ecoinvent models wastes like CMLCA as outputs of processes (in LCA software this can be displayed as negative inputs or positive outputs)
- Waste treatment activities in ecoinvent usually have a negative reference product (i.e. they model the service of treating a waste)
- Ecoinvent has a different product classification than CMLCA, e.g. (in the cut-off system model)
– Allocatable by-products (BP): like goods in CMLCA
– Wastes (W): cut-off approach (waste treatment fully allocated to producing activity; co-products come FREE of burdens)
– Recyclable materials (RM): RM come FREE of burdens, but environmental impacts from recycling accounted for
9.3.4 Consumption mixes (markets) Global geographical coverage
Consistent generation and use of consumption mixes- The transforming activities produce products that supply the markets, depending on their geographical localisation

There exists always at least one GLO market per product, but regional markets do also exist when it is necessary

Consuming activities of those products will get their inputs automatically from the markets that
better cover their geography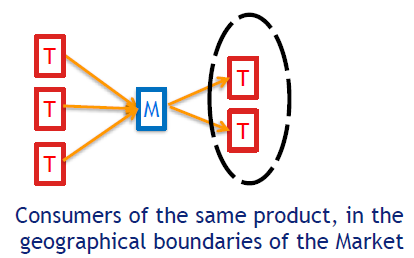
Direct links to producers can also be used instead of consumption mixes
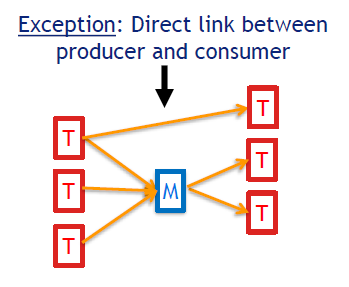
- Markets link producing and consuming activities in the geographical boundaries of the markets
- As user, you can always choose to use the producing activities or the consumption mix (market)
All products in the ecoinvent database are covered globally
- either by 1 GLO activity
- or by at least 1 regional + 1 RoW activities
The same logic applies for markets
If available, regional activities use the inputs from regional markets (e.g. the input of tap water from NL, for a NL activity)
Illustration for Global geographical activity coverage
9.3.5 Other activities
Types of activities
Several types of activities can be distinguished and will be described in more detail below. All activities have exchanges on the input side and on the output side.
Exchanges from and to the environment, also called elementary exchanges, are placed on the input side when a process consumes natural resources, such as iron ore from the ground, water from a river or CO2 taken up from the air into a tree. Elementary exchanges are placed on the output side when a process releases emissions into soil, water or air.
All other exchanges are intermediate exchanges, i.e., the products consumed or produced by a process and exchanged with other processes. On the output side, we distinguish between types of products: reference products and by-products or waste.
Construction activities
Infrastructure (i.e., capital goods) in the ecoinvent database is defined as products that have a lifetime that exceeds one year and that are not meant for consumption. This definition includes both stationary infrastructure, such as buildings, electricity or gas grids, roads, rails, mines and production facilities, and mobile infrastructure, such as machinery, tools and vehicles.
An activity producing an immobile infrastructure product often carries the term “construction” in its name. Therefore, these activities are also referred to as construction activities. The reference unit of infrastructure products in the database is most commonly “unit”, e.g., 1 unit of power plant. A construction activity usually covers the initial construction, the maintenance of the infrastructure during its lifetime, the land occupation and land transformation (if applicable) and the decommissioning for waste treatment at the end of the lifetime. The waste streams from decommissioned infrastructure leave the activity as by-product/waste outputs. The mass of the infrastructure thus leaves the construction activity with the waste streams; therefore, infrastructure products are an exception in that they do not come with properties of mass and carbon content.
Instead of mass properties, infrastructure products have properties of “lifetime” and “lifetime capacity”.
Service activities
Service activities have inputs and outputs required to perform a service on another product, without the actual input and output of the product receiving the service. Services are therefore defined as immaterial exchanges, i.e., without a physical good changing ownership.
For example, the service of sawing with a power saw does not have an input of the tree standing in the forest. Instead, the forestry process has an input of the tree standing in the forest, an input of power sawing (in hours) and an output of the felled tree. The amount of the saw, the fuel to operate it, the lubricating oil to maintain it and the emissions released during operation enter the forestry process indirectly through the service activity.
Operation activities
Processes with the term “operation” as part of their name represent the use of a specific infrastructure product, e.g., “mine operation” as opposed to “mine construction”. Operation datasets thus always have inputs of infrastructure. The term “operation” is used as a synonym for “use”. The term is applied to both industrial activities, e.g., “gold refinery operation”, and household activities, e.g., “operation, computer, desktop”. Operation activities may also fulfil the criteria to be a service activity.
The reference products of operation activities are not of any special type; they are normal products, such as refined gold resulting from gold refinery operation.
9.4 Products
9.4.1 Reference products
The reference product is the driver of a process. It is the product for which a change in demand will affect the production volume of the process (also known as the determining product). The reference product can be a good or a service.
9.4.2 By-products/waste
By-products and waste are co-produced together with the reference product but would not justify performing a process for their own sake. For example, straw is produced together with wheat grain, which is the reference product.
In most situations, by-products can easily be distinguished from reference products. Often, by-products are similar to waste and are therefore not even fully utilised, such as straw.
Within the category of by-products/waste, waste does not have an economic value, whereas by-products do have a value on the market.
The distinction between reference products and by-products/waste is process-specific, i.e., the same product can appear as a reference product in one process and as a by-product/waste of another process.
Every intermediate exchange also carries two by-product classifications that are consistent across all the processes in which the exchange appears. These classifications determine the fate of a by-product within the rules of different system models. Every intermediate exchange is classified as either waste, recyclable or allocatable product, and every intermediate exchange is classified either as a material for treatment (mft) or not a material for treatment (non-mft).
9.5 Unit Process (UPR)
The basic building blocks of the database are individual processes of human activities and their exchanges with the environment (elementary exchanges) and with the technosphere (intermediate exchanges).
The processes in the ecoinvent database represent the average production conditions within a geographical location, rather than company-specific or site-specific conditions. For example, the ecoinvent database would contain a process for the average banana production in Ecuador, rather than for banana production at the farm of a specific fruit company. Furthermore, the contained products are primarily intermediate products rather than final consumer products. For example, the database would contain wheat flour but not pasta made from that flour.
9.6 Transport in ecoinvent
Transport is modelled in market activities- The transport of goods in ecoinvent version 3 is mainly included in market activities

- Freight
- Trucks (3.5 -> 32t)
- Airplanes , helicopter
- Trains
- Ship
- Passenger transport (ICVs, EVs)
- Personal: passenger car, scooter, bicycle
- Public transport : tram , train, airplane, bus, trolleybus
Transport model simplified
- Return trip usually empty one way
- Transport distances are based on a global model for transport distances based on EU,
US, and other statistics, which provides:- Product or product group specific transport distances
- Modes of transport
This may not always be accurate, especially for locally (not globally) traded products, e.g.:
- Construction materials (gravel, concrete, stone)
- Products with low price and high volumes (tap water)
- Products which technically cannot be transported (electricity, steam)
- Waste products
- Infrastructure (buildings, landfills)
- Define transport mode (truck, ship, etc)
- Calculate the transport distance
- no need to include return trip as this is already included in the ecoinvent datasets
- If the return trip is full as well, simply divide the one way distance by 2
- Calculate “load”: transport distance * weight
- Include the transport as a service (input) into your foreground system production activities (see example below)

Background system (ecoinvent): You do not need to model transport for products you take from existing ecoinvent market activities (it is already modelled for you; if you still want to include your own transport distance, take the product from the producing activity and not the market and add the transport as described above)
9.7 System models in ecoinvent
System models set the methodological rules to calculate the database. All system models start from the same pool of individual processes of human activities (Undefined Unit Processes (UPR)) and apply different assumptions to determine the supply (linking) and the distribution of impacts between producers and consumers of products and services (allocation and substitution).
https://ecoinvent.org/the-ecoinvent-database/system-models/
9.7.1 Allocation, cut-off by classification
Introduction
In this system model, wastes are the producer’s responsibility (“polluter pays”), and there is an incentive to use recyclable products, that are available burden free (cut-off).
- If a material is recycled, the primary producer does not receive any credit for the provision of any recyclable materials.
- Recyclable materials are available burden-free to recycling processes, and secondary (recycled) materials bear only the impacts of the recycling processes (i.e. collecting, sorting, transporting).
- Producers of wastes do not receive any credit for recycling or reuse of products resulting from any waste treatment.
1. Handling of waste products
Waste by-products have to be treated, and the treatment burden is allocated completely to the waste-producing activity.
Any non-waste by-products of a waste treatment process (i.e., not other waste products) are cut off and do not provide credit to the production activity. The cut-off point is therefore the end of the waste treatment, which means that the resulting products are available in the database and can be used as burden-free inputs in other activities.
2. Handling of recyclable materials
Recyclable materials are cut off from their production activities through the use of special datasets, denoted as “product name, recycled content cut-off”. These datasets have no inputs or emissions and are therefore burden-free. In a production activity, the material is recorded as a negative input, as in the case of waste; however, the material is not linked to any treatment activity but simply to the empty process.

Special case: recycling chains
3. Handling of allocatable products
After the handling of waste and recyclable materials, allocation occurs for all remaining allocatable by-products produced within the activity. This process uses the allocation factors defined in the dataset by the dataset author. As waste and most recyclable materials (except those within recycling chains, where they remain as products) are at this point moved to the input side of the activity, they will be considered similar to other inputs and allocated over the different co-products of the activity.
9.7.2 Allocation, cut-off, EN15804
The key differences of the Allocation, cut-off, EN15804 to the Allocation, cut-off by classification system model are:
- The cut-off point between the primary and secondary system.
- The calculation of the inventory indicators required in EPDs.
Further processing (e.g. sorting) that may be required after the material has reached its end-of-waste state does not belong to the primary system. For example, recycling activities at the refiner or the remelter, are beyond the end-of-waste.
The “Allocation, cut-off, EN15804 system model” provides all Life Cycle Inventory (LCI) indicators (e.g. use of secondary material, renewable and non-renewable secondary fuels, Materials for recycling) required in EPDs (Environmental Product Declaration ).
9.7.3 Allocation at the Point of Substitution (APOS)
It follows an attributional approach in which the responsibility over wastes (burdens) are shared between producers and sub-sequent users benefiting of the treatment processes by using valuable products generated in these.
9.7.4 Substitution, consequential, long-term
In the consequential system model, all by-products are moved to the input side with a negative sign to maintain the mass balance. As no allocation is applied, the activity is burdened with the impact of all its inputs and emissions.
An unconstrained or marginal supplier can meet an increase in demand by increasing supply.Marginal supply in electricity
The marginal mixes represent the consequence of an increase in demand on the construction and operation of new electricity generating technologies.
These mixes are based on projections from (inter-)national authorities such as the European Commission (2016) and the International Energy Agency (2016).
Handling of a substitution and constrained markets
A market is constrained if there is no unconstrained supplier; the supply is therefore not fully elastic. Thus, an increase in demand will not be met by an increase in supply but rather by a reduction in consumption. The marginal consumer will demand less of the product in case of reduced supply.
10. Multi-functionality
10.1 The problem; Definitions & typologies
The problem- There are processes which have more than one function
- “multifunctional processes”


- Multi-functionality = the problem
- Four steps to consistently address the MF problem
- what are the good and waste flows of every process?
- what are the functional flows of every process?
- which processes are multi-functional processes?
- how to resolve the problems related to that?
- Allocation = one of the solutions
- partitioning (the inputs and outputs of) unit processes among product systems
Step 1: G and W flows
- Good/product (G) is a flow with an economic value ≥ 0
- Waste is a flow with an economic value < 0
Step 2: Functional flow
Functional flow: any of the flows of a unit process that constitute its goal
- good(or product) out flows of a production process
- waste inflows of a waste treatment process
- every process needs at least one functional flow
- A flow is not intrinsically a functional flow, but only with respect to a certain unit process
- More specific:
- an outflow that is a functional flow for one unit process is a non-functional inflow for one or more other unit processes
- an inflow that is a functional flow for a specific unit process is a non-functional outflow for one or more other unit processes
- Step 3: Multi-functional process
- Multi-functional process: a unit process yielding more than one functional flow
- co-production: more than one functional outflow and no functional inflow (producing 2 or more goods)
- combined waste processing: no functional outflow and more than one functional inflow (processing 2 or more wastes)
- recycling: producing ≥1 good(s) + processing ≥1 waste(s)
Mono-functional process

Multi-functional process: co-production
Multi-functional process: combined waste processing
Multi-functional process: recycling
Closed-loop
recycling
Open-loop recycling
Multi-functional process: combined waste processing & recycling & co-production
10.2 System boundary & multi-functionality; The price criterion
In between conclusions- Definition of G and W is important: may determine whether a process is multi-functional or not
- In case of recycling it matters at which point W flips to G as that determines how much impact is allocated to your product system (see Int J LCA article of allocation exercise later this afternoon)
- Non-functional waste flows (waste outflows) should be traced down to a process that will manage this waste outflow (waste management process), and that non-functional good/product inflows should be traced up to a process that produced them
- both need to be included within the system boundaries of your ‘reference flow’.
The price criterion
How to determine if flow is G or W:
- Price/direction determines:
- if a process is to be included
- if a process is multi-functional
- extent to which a process is included in case of multi-functionality
- price<0: exclude
- price>0: include a bit
- price»0: include a lot
- Is there any other principle than “price” for determining if a flow is functional or not?
10.3 Solutions to the MF problem; Discussion
ISO’s solutions to the multi-functionality problem
Possible solutions:
- more refined data collection
- system expansion (accept extra functions as extra reference flow(s))
- Substitution (Not mentioned by ISO)
- partitioning (=allocation, get rid of extra functions by an extra modelling step)
- Solution 1: Wherever possible, allocation should be avoided by:
- dividing the unit process to be allocated into two or more sub-processes and collecting the input and output data related to these sub-processes (“more refined data collection”)
- expanding the product system to include the additional functions related to the co-products (“system expansion”)
- Solution 2: Partition inputs and outputs in a way which reflects the underlying physical relationships between them (“physical allocation”)
- Solution 3: Partition inputs and outputs in a way which reflects other relationships between them
- e.g., in proportion to the economic value of the products (“economic allocation”)
Example applying the ISO solutions
Solution 1a: more refined data collection
Solving multi-functional “problem” by re-iteration of process specification & data collection
E.g., comparing 2 ways of disposing 1 kg of plastics


but are you still doing a waste management LCA? (‘managing waste’, or ‘managing waste + plastic + heat’)Change system boundary
Include extra function(s) in functional unit
Must also do this for the other alternatives
Defining an “avoided” process with subsequent “avoided” interventions/impacts
- also known as “avoided burden approach”
But which process is avoided?
- particularly important for energy substitution (coal, gas, hydro …)
Change system boundary
Add extra process
Subtract “avoided” process
With consequences upstream and downstream

Substitution: another example
System expansion ≠ substitution
- Effectively splitting the multi-functional process into several ‘virtual’ mono-functional processes

but what is the basis for splitting? (how to determine x?)
Basic principle of physical allocation
The basic principle of allocation is that having determined the various functional flows of a multi-functional process, all other (non-functional) flows need to be allocated to these functional flows according to some physical allocation principle.
- Allocate only a part of the process to the function considered
- With consequences upstream and downstream

Energy based physical allocation but can also be on basis of mass, volume, other…
- We already used the price for distinguishing between goods & wastes
- a good is a flow between two processes with an economic value higher than or equal to zero
- a waste is a flow between two processes with an economic value smaller than zero
- (Functional flows are either products produced by a process or wastes treated by a process)
- So, why not use it for allocation too ….
Basic principle of economic allocation
The basic principle of economic allocation is that having determined the various functional flows of a multi-functional process, all other (non-functional) flows need to be allocated to these functional flows according to their shares in the total proceeds.
- Allocation factors based on shares in proceeds (total amount produced (unit) ×
economic value (€/unit))- no absolute values needed
- any monetary unit, if the same
- any base year, if the same
- Market prices not known
- Fluctuating prices
- Inflation
- Trends in real prices
- Market distortions
- Markets not yet existing
- …
Examples: tilapia
Discussion
Is there one correct solution?
- Allocation problem is artefact of wishing to isolate 1 function out of the economic spider web
- Artefacts can only be cured in an artificial way; there is no “correct” way, even not in theory
- So what to do if different solutions result in highly different outcomes?
- sensitivity analysis
Closed-loop modelling (special case)
allocation doesn’t matter IF supply and demand balance

Summary: 4 mandatory steps to report on for your LCA case study
Report for each (foreground) process:
- Which flows are a good (G) or waste (W)?
- what criterion is applied for this distinction?
- What are the functional flow(s) (F)?
- Which processes are multi-functional?
- Which solution(s)/method(s) have been selected and applied including sensitivity analyses and why
- for co-production process: mandatory to apply economic partitioning and another solution as sensitivity analyses.
- Please read:
- You can find it in the Brightspace under “Reading Materials” channel under files > Literature: “Ch4-LCI Compendium-Guinee_etal(2018)-Preprint.pdf”
- There is also a video explaining once more explaining the importance of step 1-3: “IE-MF 3 steps LCA Compendium CE_Symbiosis” (see “Web Lectures”)

11. Life Cycle Impact Assessment (LCIA)
11.1 Definition of LCIA
- ISO: Phase of life cycle assessment aimed at understanding and evaluating the magnitude and significance of the potential environmental impacts of a product system.
- Often abbreviated to LCIA
for co-production process: mandatory to apply economic partitioning and another solution as sensitivity analyses
11.2 The principle of characterization
ISO definition: factor derived from a characterization model which is applied to convert the assigned LCI results to the common unit of the category indicator.
Examples: GWP, AP
CO2 and CH4 both contribute to climate change (impact category).
Global Warming Potential (GWP, characterization factor): measure for climate change in terms of radiative forcing (category indicator) of a mass-unit of greenhouse gas.
Example calculation:
- 5 kg CO2, GWP = 1
- 3 kg CH4, GWP = 28
- 1 x 5 + 28 x 3 = 89 kg CO2-eq (category indicator result)
Simple conversion & aggregation
11.3 Selection of impact categories, category indicators and characterization models
Defining impact categories: 2 main approaches- Midpoint-oriented (CML-IA, EDIP, TRACI, …)
- Endpoint-oriented: damage approaches (Eco-indicator 99, Ecoscarcity, EPS, …)
- And hybrid approaches combining/harmonizing
- midpoint and endpoint (Impact 2002+, ReCiPe, …)
General structure LCIA framework
- ISO definition: class representing environmental issues of concern to which LCI results may be assigned.
- Examples: climate change, acidification
- ISO definition: quantifiable representation of an impact category
- Examples: infrared radiative forcing, proton release
- Non-ISO definition: mathematical model of the impact of elementary flows with respect to a particular category indicator
- Examples: IPCC model for climate change, RAINS model for acidifying substances
- Provides the basis for a characterisation factor
- Human toxicity, ecotoxicity: USEtox model (Rosenbaum et
al, 2008) - PM/Respiratory inorganics: RiskPoll model (Rabl & Spadaro, 2004)
- Eutrophication, aquatic: EUTREND model (Struijs et al, 2009b) in ReCiPe
- Photochemical ozone formation: LOTOS-EUROS model (Van Zelm et al, 2008)
- We could spend weeks to discuss each of these models, but won’t do that
- there are (academic) institutes dedicated to developing & improving characterisation models only
- Developing these models is hard work
- Guinée et al. 2002: Handbook on Life Cycle Assessment (“CML 2002”)

11.4 Classification
- ISO definition: assignment of LCI results to impact categories
- Example: CO2 and CH4 are assigned to climate change

11.5 Characterization
- ISO definition: calculation of category indicator results
- Example: 5 kg CO2 and 3 kg CH4 yield 89 kg CO2-eq
General equation
- Unit of (category) indicator result:
- kg CO2-eq (climate change)
- kg SO2-eq (acidification)
Example of characterization table
- Theory: complicated models, many substances
- Practice: complete sets implemented in software:
Characterization and other impact assessment steps = push of a button
BUT:
incomplete coverage of impact categories
always some missing characterization factors
- LCA has essentially a flow character:
- inventory table: emissions/ resource extractions in kg per functional unit
- characterization table: climate change / toxicity / depletion / etc. per functional unit
- Some impacts do not fit well:
- loss of biodiversity/introduction of GMOs/etc.
- Other impacts simply subject to a lot of debate:
- toxicity
- resource depletion

Again …. there is no such thing as the GWP, ADP, ODP, …. of “1 kg of dry edible mussel flesh” !!
Be like this:
11.6 Normalization
- ISO definition: calculation of the magnitude of category indicator results to reference information
- Reference information (over a given period of time):
- area (e.g., France, Europe, the world)
- person (e.g., a Danish citizen)
- product (e.g., the most frequently used product)
Aim of normalization
To better understand the relative magnitude for each indicator results
of the product system under study.
- checking for inconsistencies
- providing and communicating information on the relative significance of the
indicator results - preparing for additional procedures
- Formula:

- Unit of normalization result: year
Equation for calculating the category total
And …result only valid for one specific “emission – year – region – CF/method” combination: for example, GWGWP100 result ≠ GWGWP500 result
- Toxicity related categories:
- Missing global inventory results (emissions)
- Missing characterization factors
- PEF category ionising radiation:
- For the PEF category ionising radiation, normalized indicator results are approximately 1000 times higher compared to results for other categories
- Again probably due to:
- Missing global inventory results (emissions)
- Missing characterization factors
- Normalization ≠ weighting !!!
- Don’t aggregate normalization results over different impact categories without
further weighting!
- Category totals may have huge data gaps leading to flawed normalization (and related weighting) results.
Example of a normalization table

11.7 Weighting
- ISO definition: converting and possibly aggregating indicator results
across impact categories using numerical factors, also called ‘weighting factors’- based on value-choices
- ISO: “weighting shall not be used for comparative assertions disclosed to the
public”
- Definition: a factor obtained with a weighting method and used to express a particular (normalised) indicator result in terms of the common unit of the weighting result.
- Monetary values
- willingness-to-pay
- damage costs
- reduction costs
- Distance-to-target methods
- Panel methods
- expert panels
- non-expert panels
- …
Equations
- Unit of weighted index:
- year (when based on normalized results)
- euro, dollar, etc. (when based on monetary valuation)
- but often renamed: ecopoints, millipoints, ELU, etc.
Example methods including weighting
Example of the results of weighting
11.8 Practice of LCIA
Practice of LCIA: from theory2practice- Different methods and approaches
- What are their real differences?
- How to choose for an approach or method?
- matter of “taste” (e.g., midpoint/endpoint), update and representativeness
- CML 1992 and 2001 / 2002
- Eco-indicator ’99
- IMPACT 2002+
- TRACI 2.0
- LUCAS
- EDIP 97 and 2003
- EPS 2000
- Ecopoints
- LIME2
- ReCiPe
- Swiss Ecoscarcity 2006
- ILCD LCIA recommended methods / PEF method
- etc.
For more details, please consult your reading material: ILCD – Recommendation for Life Cycle Impact Assessment in the European Context
EU Product Environmental Footprint (PEF)
https://eur-lex.europa.eu/legal-content/EN/TXT/?uri=CELEX%3A32013H0179
- CMLCA file with three impact assessment families (CML-IA 2001/2002, ReCiPe and the PEF) will be developed and available for use in your case studies: “ecoinvent34_cutoff_LCIAfams_Norm_LCAPR.lca”
- Theory: complicated models, many substances, hard work by many model developers, …
- Practice: complete sets implemented in software:
- impact assessment = push of a button
11.9 Choosing the right climate metric and time horizon
https://pubs.rsc.org/en/content/articlelanding/2018/EM/C8EM00414E
- Methane is a second largest contributor to climate change next to carbon dioxide
- methane has a perturbation life of only 12.4 years
- The 100 year time horizon is most common, giving a CO2 equivalent value of 28–36 for methane (depending on whether various indirect climate effects are included (oxidation to CO2 and impact on ozone creation)).
- criticism about the use of GWP:
- The selected time horizon has a large impact on the value of the metric;
- Despite its name, it does not compare gases against their effect on global temperature
- Measures an average climate forcing effect of a single pulse emission over time but gives no indication of the climate impact at an end-point in time, or that of a sustained emission.
- An increase in radiative forcing results in a temperature increase, where the degree of temperature rise is governed by the magnitude of emission (emission quantity) and radiative efficiency, as well as the existing atmospheric concentration of the GHG and the concentrations of other gases in the atmosphere (e.g.OH-and O3) .
11.10 Energy use as an indicator for environmental performance
- Cumulative Energy Demand (CED): the direct and indirect energy use throughout the life cycle, including the energy consumed during the extraction, manufacturing, and disposal of the raw and auxiliary materials.
- Method: EF v2.0 2018 - energy resources: non-renewable - abiotic depletion potential (ADP): fossil fuels
- Upper Heating Values of Fossil Primary Energy Resources (MJ kg-1):
- Coal, brown, in ground, 10
- Coal, hard, unspecified, in ground, 19
- Gas, natural, in ground, 40
- Oil, crude, in ground, 46
- Peat, in ground, 12.5
- Uranium, in ground, 5.6e+05
- We conclude that the use of fossil fuels is an important driver of several environmental impacts and thereby indicative for many environmental problems.
- Land use should be used as a separate indicator for environmental performance, next to fossil CED.
- A major reason for this high uncertainty is non-fossil energy related emissions and land use, such as landfill leachates, radionuclide emissions, and land use in agriculture and forestry.
12. Life Cycle Interpretation
12.1 Definition of life cycle interpretation
- ISO: Phase of life cycle assessment in which the findings of either the inventory analysis or the impact assessment, or both, are combined consistent with the defined goal and scope in order to reach conclusions & recommendations
- The fourth and last phase of an LCA
- no abbreviation like LCI or LCIA
Procedural approaches: interpretation in ISO 14044
- no abbreviation like LCI or LCIA
- Identification of significant issues
- Evaluation
- completeness check
- sensitivity check
- consistency check
- Conclusions, recommendations and reporting
- critical review
12.2 Procedural approaches: interpretation in ISO 14044
- Objective: to structure the results from LCI and/or LCIA in order to determine significant issues (‘hot spots’), e.g. certain:
- inventory data such as energy, emissions, waste, …
- impact categories such as resource use, climate change, …
- significant contributions from life cycle stages to total LCI or LCIA results such as individual unit processes or groups of processes, …
- Objective: to establish and enhance the confidence in and the reliability of the results:
- completeness check: to ensure that all relevant information and data are available and complete
- sensitivity check: to assess the reliability of the final results and conclusions
- consistency check: to determine whether the assumptions, methods and data are consistent with the goal and scope
ISO: “The objective of the completeness check is to ensure that all relevant information and data needed for the interpretation are available and complete. If any relevant information is missing or incomplete, the necessity of such information for satisfying the goal and scope of the LCA shall be considered. This finding and its justification shall be recorded. If any relevant information, considered
necessary for determining the significant issues, is missing or incomplete, the preceding phases (LCI, LCIA) should be revisited or, alternatively, the goal and scope definition should be adjusted. If the missing information is considered unnecessary, the reason for this should be recorded.”Examination of difference in data completeness between alternatives compared, by expert judgment, intuition, reputation of data suppliers, …
Compare your study with other similar studies
- Note: no 2 LCAs are really comparable !
Check differences in completeness between alternatives compared
- E.g., differences in completeness of flowcharts, cut-offs made, ….
Identify differences in type and number of substances not captured by characterization between alternatives compared
- CMLCA: “Flows without characterization factors” in “Classification” menu

- CMLCA: “Flows without characterization factors” in “Classification” menu
- Determining how final case study results are affected by data uncertainties, allocation methods, characterization methods, etc.
- Sensitivity check shall include the results of sensitivity analysis and uncertainty analysis, if performed in the preceding phases (LCI, LCIA)
- ISO: The objective of the consistency check is to determine whether the assumptions, methods and data are consistent with the goal and scope. If relevant to the LCA or LCI study the following questions shall be addressed.
- Are differences in data quality along a product system life cycle and between
different product systems consistent with the goal and scope of the study? - Have regional and/or temporal differences, if any, been consistently applied?
- Have allocation rules and the system boundary been consistently applied to all
product systems? - Have the elements of impact assessment been consistently applied?”
- Are differences in data quality along a product system life cycle and between
- Differences in data sources, e.g.,
- product A literature; product B primary data
- Differences in data accuracy, e.g.,
- A detailed processes; B cumulated black-box system
- Differences in technology coverage, e.g.,
- A experimental data; B existing large-scale technology
- Differences with time-related coverage, e.g.,
- A brand-new technology; B outdated technology mix
- Differences in data age, e.g.,
- A 5-year old primary data; B recently collected data
- Differences in geographical coverage, e.g.,
- A repr. EU technology mix; B one EU member state

- discuss consistency, completeness, sensitivity etc. in relation to goal of student’s specific case study; not just in general terms repeating the
theory - With everything you found, uncertainties, gaps you had, can you answer that RQ, what is the validity of that answer, importance of cutoffs, choices you made (e.g. FU), possibly putting your results in a bigger picture, ….
- Objective: to draw conclusions and make recommendations for the intended audience
- Important topics:
- transparent reporting
- all ISO aspects (phases, steps, data, assumption, choices) can be easily found
- how to report results
- critical review
- role and exact form depend on goal of the study
- transparent reporting
Examples of conclusions

- Conclusions should comprise of the main results and a discussion of its validity and reliability
- summary of significant issues
- evaluation of methodology and results applying consistency and completeness checks, and sensitivity and uncertainty analysis
- main conclusions as relate to goal and scope of study, data quality, assumptions,
etc.
LCA focusing on climate change impacts only:
- you can’t formulate a conclusion as: “Product A performs environmentally better
than product B …”. - You can only conclude: “On climate change impacts, product A performs better
that product B ….. Trade-offs to other impact categories have not been analysed”
.. or something similar.
- you can’t formulate a conclusion as: “Product A performs environmentally better
Conclusions are only valid for the systems analysed, and not for other systems!
- LCA results for 1 litre packaging do not automatically also apply to 1.5 litre
packaging
- LCA results for 1 litre packaging do not automatically also apply to 1.5 litre
- Inconsistencies, incompleteness, sensitivities, uncertainties and errors (that cannot be repaired)
- should either be corrected or incorporated in conclusions & recommendations of the study
- Studies often include sensitivity analyses
- but don’t mention their results in the conclusions
12.3 Numerical approaches
From ISO procedural to numerical approaches for practice- ISO only provides procedural approaches, no guidance on numerical approaches
- Numerical approaches have been added by LCA methodology developers to basically implement the ISO guidelines in practice!!
- From ‘checks’ to ‘analysis’
- Contribution analysis ISO: "identification of significant issues"
- Perturbation analysis ISO: "Sensitivity check"
- Comparative analysis
- Other sensitivity (than perturbation) analysis (tomorrow)
- Uncertainty analysis (optional; tomorrow)
- Discernibility analysis (not treated)
- Key issue analysis (not treated)
- …..
- Also known as dominance or hot-spot analysis: decompose results into contributing items (e.g. % of total)
- Can be performed at several levels:
- inventory analysis
- characterization
- normalization
- weighting
- Can be performed on different items:
- processes
- interventions
- impact categories
Example 1: Process contribution for fresh mussel processing and consumption
Example 2: Process contribution to impact categories of biomethane production from offshore-cultivated seaweed
- Application-oriented:
- results of contribution analysis may provide opportunities for redesign, prevention strategies, etc.
- Analysis-oriented:
- precise knowledge of data is more important for highest contributors, than for
those that hardly contribute - testing results against what one would intuitively expect
- precise knowledge of data is more important for highest contributors, than for
- ‘False negatives’ due to underestimated or missing flows cannot be identified with contribution analysis
- Problems with “negative contributions” (due to negative emissions, e.g. CO2 uptake, applying ‘avoided burdens’ approach, or a negative CF)

- Results only indicate direct contributions of item (e.g., CO2 emission) analyzed
- use process expected to be dominant in LCA of TV
- however, TVs don’t emit themselves (‘clean’ process), but may use lot of kWh -> power generation dominant
- Consult CMLCA -> Inventory results (-> v More) -> Matrices
- Technology (A) – Original: shows the economic process data of ecoinvent processes + added processes (and/or ecoinvent changes) by user
- Satellite (B) – Original: shows the environmental process data of ecoinvent processes + added processes (and/or ecoinvent changes) by user
- Transformed matrix: square A-matrix based on the results of cut-offs and allocation
- Scaled transformed technology (A) matrix: A-matrix times the scaling vector; for every row (product) you get exactly the final demand, which for most products is zero except for your FU/reference flow
- Scaled transformed satellite (B) matrix: B-matrix times the scaling vector; for every row (extension) you get exactly the inventory results for your FU; note that the results are provided per process which constitutes the basis of the CMLCA contribution analysis
- (Inverted technology matrix is the basis for calculating the scaling vector; see Tuesday’s lecture)

- The standard contribution analysis calculates the contributions by each process (≥ 14889 columns if ecoinvent is used!) to the total
- Other analyses are possible but basically aggregate processes (columns) in groups:
- Stages
- Background/foreground
- Any label …
- Region
- Year
- In scientific publications it’s often not explained how life cycle stage contribution analyses have been performed while these may contain a lot of choices
Software implementation in CMLCA
- Also known as marginal analysis or sensitivity analysis: investigate inherently unstable items
- change data/factor with 1%, and determine how much a result is changed
- Multiplier: extent to which perturbation of certain input parameter
propagates into certain output result- if an increase of 1% of an input parameter leads to an increase of 2% of an output result, multiplier 2
- if output result decreases by 2%, multiplier is -2
- multipliers restricted to marginally small changes
- Can be performed at several (output) levels: inventory analysis; characterization; normalization; weighting
- Can be performed at all (input) process data (technology matrix A)
- No specification of parameter uncertainties needed
- Contrary to contribution analysis, perturbation analysis covers both
economic and environmental flows
- Purposes:
- application oriented: results of perturbation analysis may provide opportunities
for redesign, prevention strategies, etc. - analysis oriented: precise knowledge of data is most important for highest multipliers
- application oriented: results of perturbation analysis may provide opportunities
- Restrictions:
- time-consuming for numerical solutions; analytical solutions very fast
Software implementation in CMLCA
- Systematic place to list the LCA results for different product alternatives simultaneously
- Can be performed at several levels
- inventory analysis
- characterization
- normalization
- weighting
- Purposes:
- to provide presentations of results on the basis of which different product alternatives can easily be compared
- Restrictions:
- comparative analysis is seductively simple
- dangerous, because it may easily induce claims without a proper analysis of robustness of these claims with respect to influence of uncertainties
Software implementation in CMLCA
12.4 Concluding remarks
Concluding remarks: future of interpretation- Numerical approaches will win ground, particularly uncertainty and sensitivity analyses
- Dilemma:
- need to improve LCA-software so that uncertainty estimates of input parameters
can be handled - need to add uncertainty estimates to LCA-databases (uncertainty data)
- most current LCA software cannot deal with them, lowering priority for collecting
such data
- need to improve LCA-software so that uncertainty estimates of input parameters
Use common sense to identify data quality issues
Apply contribution analysis to identify hot-spots
Apply sensitivity analysis
Identify limitations of:
- LCA as tool, and
- study at stake
Use common sense to formulate conclusions and recommendations properly reflecting potential data issues, hot-spots, and identified limitations.
Always critically ask yourself “why are my results as they are?”
- Do they feel intuitively correct?
- If not, can you explain why they are counter-intuitive?
- What are the key processes or variables explaining differences between alternatives?
- ….
And thus ….:
- Can you explain them to third parties involved?
- Can you base correct and clear conclusions and recommendation on them?
Don’t ever consider LCAs as a push o n the button of CMLCA, SimaPro, OpenLCA, GaBi, …
13. Sensitivity and uncertainty analysis
13.1 Difference between sensitivity analysis and uncertainty analysis
What’s the difference?
- Although closely related, sensitivity analysis and uncertainty analysis comprise of
different techniques- Local sensitivity analysis (one at a time (OAT)) assesses the changes in results due an arbitrary change in a single input parameter (ignoring its uncertainty)
- Global sensitivity analysis assesses the contributions of the inputs to the total uncertainty in analysis outcomes taking into account the simultaneous variation of (all) input variables
- Uncertainty analysis assesses the uncertainty in model outputs as a result of uncertainty in inputs
What do they mean in LCA?
- LCA practice so far has mainly focused on local SA (not needing any uncertainty
data as input), but this is slowly changing to including uncertainty analysis and
occasionally also GSA
- Uncertainty
due to lack of knowledge about a “true” value- can be reduced by more / better knowledge or more accurate precise measurements
- Data uncertainty, model uncertainty, ….
- Variability
due to variation in data sample- Cannot be reduced but better and more sampling can improve knowledge about the variability
- Spatial variability, Temporal variability, Variability between objects and sources
- Uncertainty in this lecture now refers to both uncertainty and variability, and can either be approached by SA or UA
- Uncertainty and variability hard to distinguish in practice anyway, and often lumped (al
- Functional unit (SMS, call, email)
- LCI (knowledge about the supply chain)
- Material inputs
- Manufacturing
- Distribution
- Use
- Disposal
- Data Sources
- Allocation Choice
- Characterization (LCIA; e.g., fate & transport modelling)
13.2 Local sensitivity analysis
Ad-hoc one-at-a-time (OAT) local sensitivity analysis (common practice in LCA today)- Define the subject of the sensitivity analysis:
- Ad hoc changing parameters, choices, … (“scenarios”)
- Systematic change of parameters (perturbation analysis; only parameters, not choices)
- Evaluate change in results
- If comparative, how does it affect conclusions & recommendations?

Other example: choice of allocation method
- Most influential assumptions
- also use contribution analysis results for selecting subjects for sensitivity analyses
- Define the conditions for environmental performance determined
- Include them in conclusions: A>B if…
- Select sensitivity topics carefully
- Use results of contribution analysis
- Familiarize with literature
Short software exercise: choice of allocation method
Open the file “allocation exercise3.lca” in CMLCA:
- Calculate the inventory results and export them to an excel file for comparison
with results of two sensitivity analyses below. - Sensitivity analysis 1: change the allocation method for P4 to “Equal”, calculate the inventory results, and export results to the same excel file for comparison.
- Sensitivity analysis 2: Change the prices for W3 ‘used engine’ from -100 -> -50 €/engine, and for G5 ‘aluminium scrap’ from 30 -> 50 €/kg, calculate the inventory results, and export results to the same excel file for comparison.
- Sort out further details of how to do these sensitivity analyses yourself together
with your colleagues.
Systematic OAT local sensitivity analysis (Perturbation Analysis)
Perturbation analysis: recall yesterday’s example

Wrap up
Sensitivity & uncertainty analysis
- Sensitivity analysis in LCA: propagating/calculating the effect of a
number of changes- Focus on local sensitivity analysis here (OAT)
- ad hoc (scenarios)
- systematic (perturbation analysis)
- perturbation analysis: specific and automated sensitivity analysis changing, one at a time, technology matrix parameters by 1% and determining how that changes the results*
- Focus on local sensitivity analysis here (OAT)
- Uncertainty analysis (not mandatory)
Closing remarks
Exercise 6.1: Perturbation Analysis
Software Exercise
Perturbation Analysis in CMLCA
-steps in CMLCA
-ways of graphing it
-How to use it in conclusions
13.3 Uncertainty analysis (Optional)
Storyline in a nutshell- Easy to understand that LCA results are uncertain
- But today we can treat uncertainties
- However, we need to understand that LCA is also relative: thus we need to properly combine uncertain and relative
- And we need not only to include uncertainty on data but also for methodological choices
- Let’s briefly discuss some lessons and principles
- Don’t consider uncertainty or mention it only a bit in the discussion
- Check yourself: how many articles did you read in the past year in which
- histograms or standard deviations of LCA results appeared
- hypothesis test (“product A is better than product B”) appeared
- Most studies
- mention some uncertain issues (“end-of-life data is quite uncertain”)
- do one or two scenarios (“we recalculated results with a much shorter life span”)
- ignore uncertainty whatsoever
- state results in point values and many digits (e.g. 42.010347)
- LCAs and PCFs of identical products can deviate by an order of magnitude
- process data (empirical, modelled, from databases)
- choices on allocation
- characterization factors
- However, several methods have been proposed to deal with uncertainties ….
- and some data are available
- pedigree-based uncertainty
- different data sets for same unit process
- different LCIA methods
Obtaining uncertainty data is still a huge challenge Pedigree Matrix: Data Quality Indicators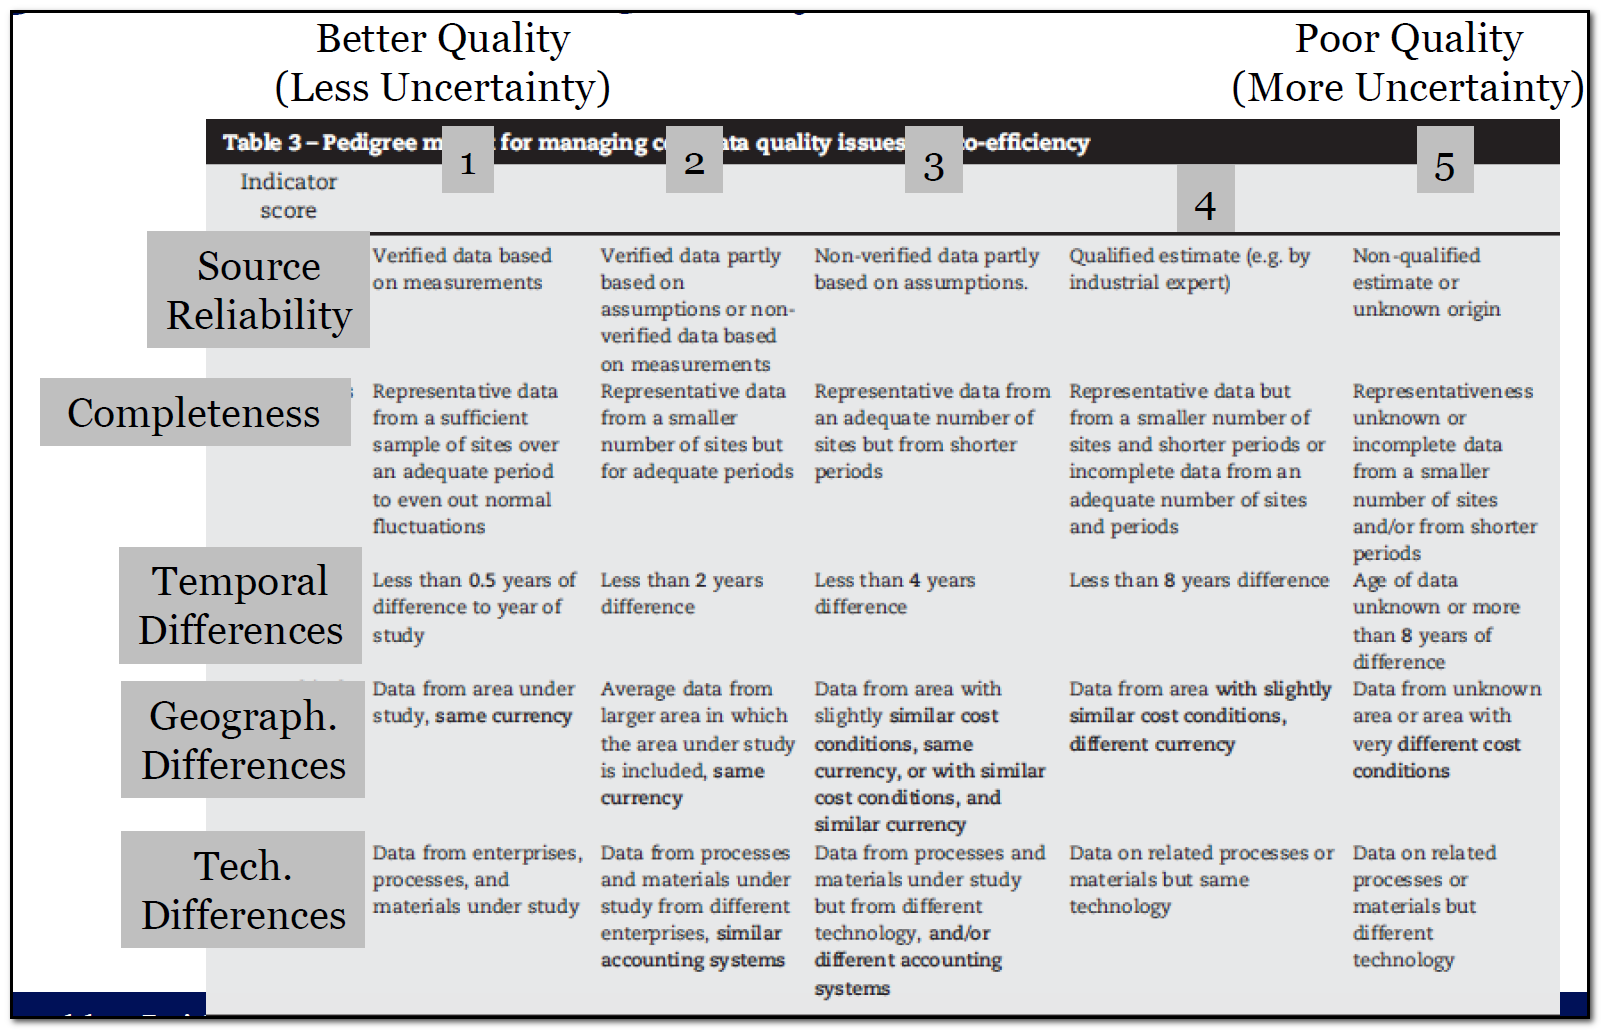
Pedigree matrix: quantifying Data Quality Indicators
- By way of example

- The value of 𝑥 differs
- per car type
- may have to be averaged over different car types depending on G&S
- but even per car of the same type depending on:
- driver
- weather type
- day and time of the day
- …
- per car type
Treating uncertainty (for data)
- Consequently, there is no “true value” of 𝑥
- The value of 𝑥 is a realization of a stochastic variable 𝑋
- We should specify a probability distribution for 𝑋
- (e.g., normal with mean 5 and standard deviation 1)
- So, 𝑥 is a realization of 𝑋~𝑁 (5,1)

- There is also no “true value” of 𝑦
- The value of 𝑦 is a realization of a stochastic variable 𝑌
- We should specify a probability distribution for 𝑌 (e.g., normal with
mean 2 and standard deviation 0.1) - So, 𝑦 is a realization of 𝑌~𝑁 (2,0.1)
Propagating to output uncertainties
- There is also no “true value” of 𝑧 etc.
- The value of 𝑧 is a realization of a stochastic variable 𝑍; the value of 𝑢 is a realization of a stochastic variable 𝑈; etc.
- We can use the methods of probability theory to calculate the distribution of 𝑍, 𝑈, etc., e.g. Monte Carlo simulation
- MC requirements: mean, variance and distribution for each unit process data point
- In MC, values are randomly sampled from the unit process distributions over a
fixed number of iterations and aggregated into LCA results using LCA calculation
software
Useful intro to MC methods: https://www.youtube.com/watch?v=t0F3S-46bIQ
- By way of example

- The value of 𝑢 differs, just as that of 𝑥
- per car type, etc.
- But 𝑥 and 𝑢 do not vary independently
- more gas in, more CO2 out
- 𝑥 high, 𝑢 high
- So, 𝑋 and 𝑈 are correlated
- OK, there are cases where LCA is absolute
- one stand-alone analysis, for finding hot-spots
- LCAbsolute, an initiative to reconcile LCA and planetary boundaries
- but in the vast majority of cases the purpose is (comparative)
- GWA > GWB
- rather than (absolute)
- GWA=12.4±2.1 and GWB=11.8±1.9
- Comparative requires MC dependent sampling & A-B comparison per MC run
Correlations between systems compared (shared processes)
LCA is uncertain and relative
MC dependent sampling & A-B comparison per MC
- Changing GWA=12.4±2.1 and GWB=11.8±1.9 into ΔGW=0.6±0.1
- So, not 1000 MC runs for A and then 1000 MC runs for B; but 1000 simultaneous MC runs for A and B while calculating A-B for each run (since only for a specific MC run, the data for shared processes is similar for A and B)

Similar approach for methodological choices
[…] to simultaneously propagate uncertainty in unit process data and the sensitivity due to the choice of allocation methods […] to LCA results [..] with the potential to be applied to other methodological choices”.
Interpretation of uncertainty results
CML has a strong track record

- Heijungs et al. (2019) Int. J. Life Cycle Assess. DOI 10.1007/s11367-019-01666-y
- Mendoza Beltran et al. (2018). Environ. Sci. Technol. 52(4), 2152-2161
- Groen & Heijungs (2017). Environ Impact Assess Rev 62, 98-109
- Mendoza Beltran et al. (2016). Int. J. Life Cycle Assess. 21 (2), 252-264
- Henriksson et al. (2015). PLOS ONE 10(3): e0121221
- Henriksson et al. (2014). Int. J. Life Cycle Assess. 19 (2), 429-436
- De Koning et al. (2010). Int. J. Life Cycle Assess. 15 (1), 79-89
Exercise 6.2: Uncertainty Analysis (DQI) Optional software exercise (optional h☺mework)
DQI in CMLCA
- Uncertainty analysis
- Histograms
- Discernibility Analysis
14. Graphing LCA results
14.1 LCA results

1. Comparative results at characterization
Improve on this example by using scientific notation when reporting values and correct impact category names by removing “potential”.

Contribution Analysis
Normalization
14.2 Critique the graph
Characterized results


Normalization


Contribution Analysis


- Graphs should support interpretation of results, not complicate
- Clear graphs can enhance communication of results and overall quality of the report
- Make sure to include: captions, axis labels, series labels, legend
- Accompany results with a comment/discussion
- Sometimes tables are better than graphs
15. Case study design and reporting
15.1 Reporting & writing tips
Course study goals- Write an LCA research proposal;
- Conduct an LCA study;
- Report LCA results in a reproducible manner;
- Understand the possibilities and constraints of their LCA study.
** Convince us that you understand LCA!**
Scientific writing tips - Follow our mandatory reporting guidelines!!
- In addition: use LCA Handbook (structure)
- One topic per paragraph
- Avoid long sentences
- Use proper and simple English (check synonyms, spelling, grammar, …)
- Let someone (fellow student) else read your text before you submit it
- Literature to be consulted optionally:
- Scientific writing: Hengl, T. and Gould, M., 2002. Rules of thumb for writing research articles
- Example of good LCA reporting: Hawkins, T.R., et al. (2013), Comparative Environmental Life Cycle Assessment of Conventional and Electric Vehicles, J ind Ecol 17(1): 53 - 64
Max. 2000 words incl. 300 word abstract (excl. references)
Problem statement (at least 2 LCA studies on your topic)
Research aim (why is LCA the right tool?)
Research question !!
Method
- 1 flowchart for each alternative (no copies from literature!)
- Function, FU, alternatives, reference flow
Data sources
Discussion (possible difficulties and their solutions)
Planning (including milestones etc.)
Proposal is like a preliminary GSD
See also research proposal assignment, follow general report structure on the previous slide
- Author name (also in the document name)
- Page numbers (!!)
- Captions (!!)
- Abbreviations with explanation
- Don’t forget a proper review of relevant LCA literature
- Structure of your story
- Avoiding extremely long sentences with difficult words (please, let someone else read your proposal before submitting)
- Avoid data collection via interviews (or if really needed: report the interview appropriately)
- Avoid using GWP as global warming, …etc.: terminology!!
- Choose a topic you understand, learning LCA is difficult enough
- Finding literature and referencing
- Project planning!!!
Final reporting requirements
Mandatory final report structure
LCA model requirements
You will be graded on:
- A proper model that works;
- Fulfills the modeling requirements (see Course Rules!!!)
- Clear and organized labeling of processes and flows
- Matching process names between flow charts and CMLCA model;
- Logical build up of your model;
- Proper explanation of assumptions, allocation and modeling choices in your main report;
- Consistent with flow chart in your report.
15.2 Frequently made modelling CMLCA mistakes
15.2.1 Functional unit and reference flows
Example 1- Function: the provision of electricity
- FU: 1 kWh of net electricity produced
- Reference flows: 1kWh electricity produced by
- a coal power plant with oxyfuel combustion
- a coal power plant with MEA scrubbing
- a reference coal power plant in The Netherlands
- Implementation in CMLCA:


- Function: ?
- FU: 500ml of extra-virgin olive oil to be used as salad dressing or cooking
- Reference flow: ?
- Implementation in CMLCA:


- Topic: plastic bottles vs cans
- Function: ?
- FU: distribution of soft drinks to consumers
- Reference flow(s): 1500 liter of soft drinks to the consumers
- Implementation in CMLCA:


15.2.2 Manipulating ecoinvent or connecting your processes to ecoinvent
Example 1: OK?
Example 2: OK or not?
Example 3: starts OK …
… but what goes wrong here?
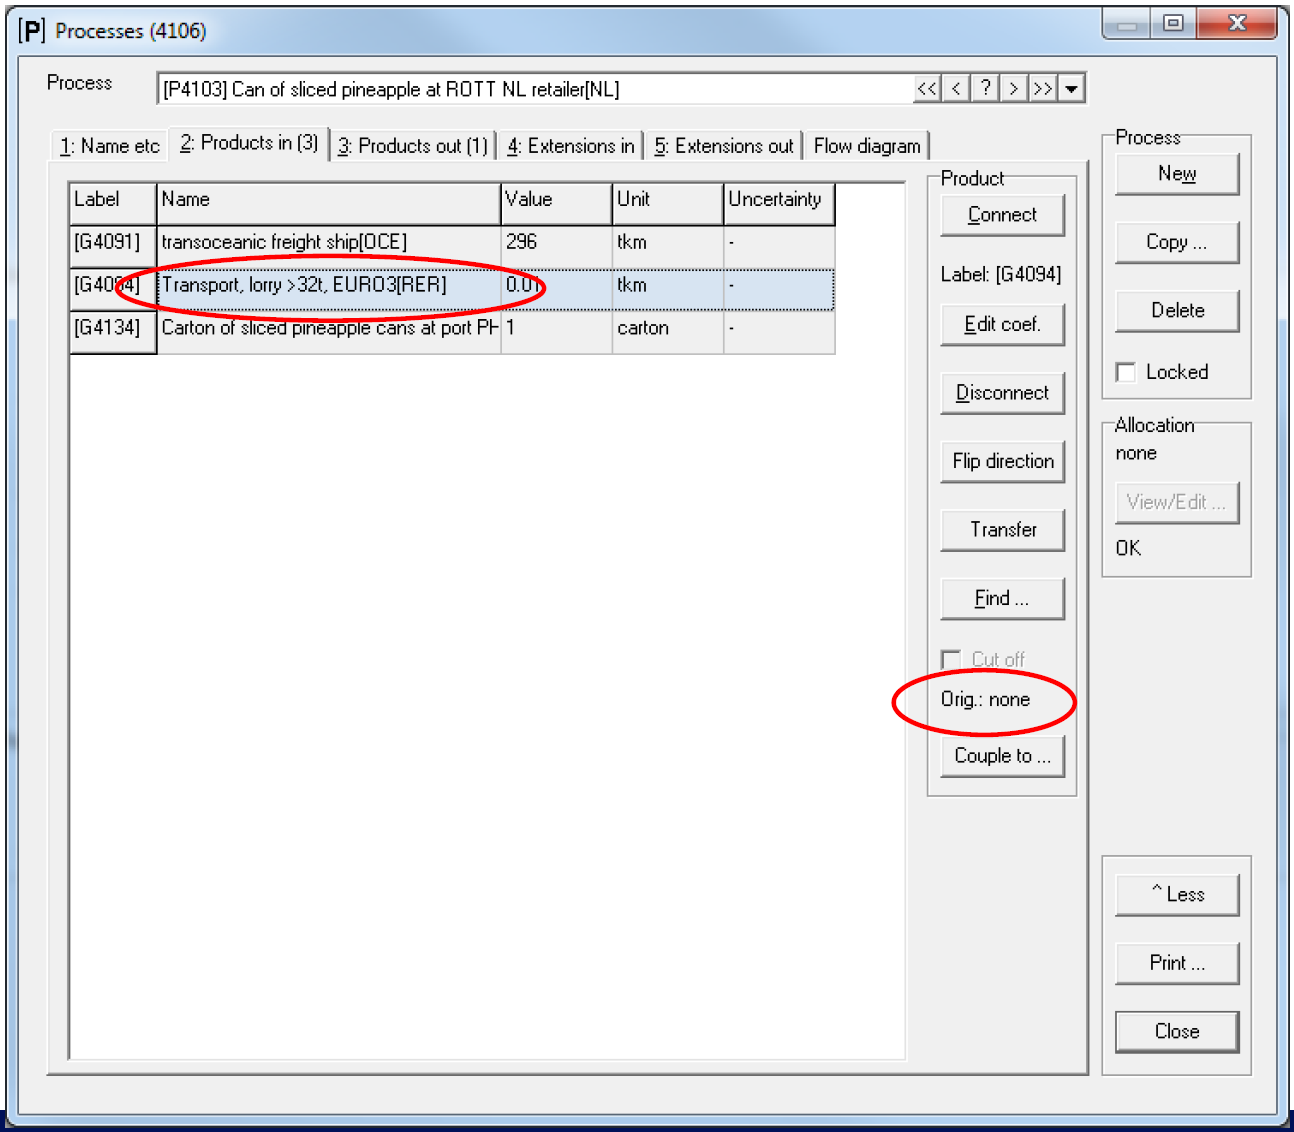
15.2.3 Other more advanced implementation issues
Example 1: study comparing beer and its packaging modeling and comparing the impacts of recycling beer bottles


Example 2


Difference between unit process data and inventory table !!
Unit process data

15.3 Frequently made reporting mistakes
What we saw in previous courses…
Content tables


Goal and Scope reporting
What’s the difference between the left
and right examples?
Other reporting issues
Sloppy mistake
This is unnecessary and very annoying for your readers, us.
Huh?


Too long sentences
Logic
What is wrong?

Using other databases than ecoinvent
Other LCA databases…
- We definitely advise you against importing other databases than
ecoinvent- Automatic import of other databases almost always goes wrong and leads to many
of the abovementioned errors - Better manually import some selected processes from these databases, as far as
useful for your study
- Automatic import of other databases almost always goes wrong and leads to many
Databases
source: https://nexus.openlca.org/databases
Nibe database for building sector (NL; free registration required): http://www.nibe.org/nl/diensten-en-producten/onderzoek/LCA
https://nexus.openlca.org/
Global LCA Data Access network (GLAD)!
https://www.globallcadataaccess.org/
Global CO2 Initiative
https://assessccus.globalco2initiative.org/lca/databases/
15.4 Further planning of the course
- Research proposal
- Deadline: October 4, before 9 AM
- Feedback: ~ within 5-10 working days
- No retake possibility
- Presentation of preliminary findings and draft CMLCA model
- October 26, before 9 AM (!!) send in your draft CMLCA file
- October 29, send in your presentation and attend presentation day
- No retake possibility
- Final case study report and LCA file
- Follow final report requirements!
- Due December 6, 9 AM!
- ~before X-mas (grades)
- 24th January (retake)
- Communication:
- Post all your questions on Brightspace “Q & A: sessions, locations etc.”
- Help each other and learn from each other
- Every Monday 10:00-11:30 during the course period – starting from October 1 onwards (with optional session on September 20) -, questions posted that week will be answered and discussed in class (see schedule on Brightspace)
- New technologies, chemicals, materials and products are proposed everyday
- Many claims are made:
- “sustainable”, “safe”, “100% organic”, “green”, “recyclable”, “cradle2cradle”, “bio’, “bio-based”, “ecofriendly”, “natural”, ….
- However, don’t claim but prove first
- Mostly used assessment method: environmental LCA
- LCA works perfectly for existing systems, with known specs, processes and data
(ex-post) - But how can we use LCA for emerging technologies with unknown specs, processes and data?
- Upcoming: how can we use ex-ante RA and ex-ante LCA in combination to chemical safety issue (SSbD)
- SSbD refers to designing new chemicals, materials, products and processes (technologies) while including safety right from the beginning of R&D
Ultimate goal: LCA insights guiding R&D
- ex-ante LCA
- anticipatory LCA
- prospective LCA
- early-on LCA
- You have successfully completed the LCA-PR course ☺
- 4413LCA9EY LCA Practice & Reporting
- Ex-ante LCA adopts the same LCA method as you learn in this course but with some additional challenges, see van der Giesen et al. 2020
- Guinée, J.B. & R. Heijungs (2021). Waste is not a service. Accepted for publication in Int J Life Cycle Ass. DOI: 10.1007/s11367-021-01955-5
- Blanco, C.F. et al. (2020). Environmental impacts of III-V/silicon photovoltaics: life cycle assessment and guidance for sustainable manufacturing. Energy Environ. Sci. 13. https://pubs.rsc.org/en/content/articlehtml/2020/ee/d0ee01039a
- Giesen, C. van der et al. (2020). A critical view on the current application of LCA for new technologies and recommendations for improved practice. J Clean Prod 259, 120904. https://dx.doi.org/10.1016/j.jclepro.2020.120904
- Tsoy, N. et al. (2020). Upscaling methods used in ex ante life cycle assessment of emerging technologies: a review. Int J Life Cycle Ass 25(9), 1680-1692. https://doi.org/10.1007/s11367-020-01796-8
- Oers, Lauran van et al. (2020). Top-down characterization of resource use in LCA: from problem definition of resource use to operational characterization factors for dissipation of elements to the environment. Int J Life Cycle Ass (25)11, 2255–2273. https://doi.org/10.1007/s11367-020-01819-4
- Guinée, Jeroen B., Stefano Cucurachi, Patrik J.G. Henriksson, and Reinout Heijungs (2018). Digesting the alphabet soup of LCA. Int J Life Cycle Ass 23(7), 1507-1511. https://link.springer.com/content/pdf/10.1007%2Fs11367-018-1478-0.pdf
- Guinée, J.B. et al. (2017). Setting the stage for debating the roles of risk assessment and life-cycle assessment of engineered nanomaterials. Nat Nanotechnol 12, 727-733. https://www.nature.com/articles/nnano.2017.135
- ………
- Villares, M. et al. (2017). Does ex ante application enhance the usefulness of LCA? A case study on bioleaching of e-waste for metal recovery. Int J Life Cycle Ass 22(10), 1618-1633. https://link.springer.com/article/10.1007/s11367-017-1270-6
- Villares, M. et al. (2016). Applying an ex-ante life cycle perspective to metal recovery from e-waste using bioleaching. J Clean
Examples of recent master theses on ex-ante LCA
16. Jumpstarting your LCA case study
Canned or fresh pineapples?
Is fresh the greener option?
- Grown in Costa Rica and the Philippines, consumed in The Netherlands;
- Of the fresh pineapple only 40-50% (by mass) can be eaten. So about half its weight is transported and then thrown away;
- Fresh pineapple needs to be transported at 7°C;
- Canned pineapple is more efficiently transported and has longer shelf life;
- Canned pineapple needs processing and canning
- Starts in your research proposal (see that as preliminary GSD)
- Literature search and review
- Google / scholar.google (also look for other LCA studies on pineapples)
- Other search engines: f.e. web of science
- Annual reports (Dole and other suppliers?)
- ecoinvent (via CMLCA) and background reports
- Other search terms (canned fruit?….)
Inventory phase
- Background and foreground processes
- From general data (literature) to unit process data
- Not in ecoinvent, assume no other process data available. Adjust existing ecoinvent process.
- As a proxy use sugar cane [BR] (P2700)
- What we do know
- 1000 kg pineapple / 100m2 => 1 kg pineapple / 0,1 m2
- Cans are not in ecoinvent
- Search for data (provide references!)
- Model yourself. Simple Assumptions cans are made of aluminum, you need electricity to produce them and they are produced in a building.
- Pure hypothetical data
- Factory produces 1.000.000 cans / year
- Consumes 20.000 kWh electricity / year
- Consumes 30 tons aluminium / year
- Factory is 100 m2 with a lifetime is 20 years
- Consumes 20.000 kWh electricity / year => 0,02 kWh electricity / can (G129)
- Consumes 30 tons aluminium / year => 0,03 kg aluminium / can (G17)
- Factory produces 1.000.000 cans / year, Factory is 100 m2 with lifetime of 20 years => 5 x 10⁻⁶ m2 of factory / can (G583)

- 50% by mass is transported rest is waste
- Needs pineapple (how much?)
- Needs a can (how many?)
- Transport is defined as service in ecoinvent (f.e. disposal as well)
- Transport process => reference flow is [tkm]
- transporting 1000 kg over 200 km = 200 tkm

- transporting 1000 kg over 200 km = 200 tkm
There are basically 2 options for modelling your own disposal process: 1) connecting a waste flow out to an ecoinvent waste process (and accepting its data); 2) defining a new disposal process managing your specific waste, calculating 3 emissions yourself applying chemical reactions and mass balancing (IN = OUT) fulfilling the “3 emissions calculation requirement” below, and optionally copying data on economic inflows like electricity and fuel needs from an existing similar ecoinvent process. ↩︎
You cannot use the same process to fulfill the closed loop and the multifunctionality co-production requirements; you need separate processes for that. Closed loop also involves a multifunctional problem, but the solutions (either allocation or substitution) don’t change the results as will be/has been discussed in class. Therefore, you are also required to model a co-production process with at least one functional flow crossing the system boundary. ↩︎
Three extensions should be calculated yourself, not taking them from literature. The idea behind this requirement is that you calculate, e.g., some emission values yourself from just looking at the composition of an economic flow and making mass balances. For example, the incineration of a product containing C, S and Cd will lead to emissions of CO, CO2, SO2 and Cd that can be estimated using assumptions from literature and applying mass balance principles and chemical reaction equations. ↩︎
