Literature review on the land use of future energy
https://www.sciencedirect.com/science/article/pii/S1364032108001354
Land use and electricity generation: A life-cycle analysis
Renewable and Sustainable Energy Reviews
Volume 13, Issues 6–7, August–September 2009, Pages 1465-1474
Vasilis Fthenakis¹, Hyung Chul Kim²
¹ National Photovoltaic Environmental Research Center, Brookhaven National Laboratory, Bldg 475B, Upton, NY 11973, United States
² Center for Life Cycle Analysis, Columbia University, New York, NY 10027, United States
Abstract
Renewable-energy sources often are regarded as dispersed and difficult to collect, thus requiring substantial land resources in comparison to conventional energy sources. In this review, we present the normalized land requirements during the life cycles of conventional- and renewable-energy options, covering coal, natural gas, nuclear, hydroelectric, photovoltaics, wind, and biomass. We compared the land transformation and occupation matrices within a life-cycle framework across those fuel cycles. Although the estimates vary with regional and technological conditions, the photovoltaic (PV) cycle requires the least amount of land among renewable-energy options, while the biomass cycle requires the largest amount. Moreover, we determined that, in most cases, ground-mount PV systems in areas of high insolation transform less land than the coal-fuel cycle coupled with surface mining. In terms of land occupation, the biomass-fuel cycle requires the greatest amount, followed by the nuclear-fuel cycle. Although not detailed in this review, conventional electricity-generation technologies also pose secondary effects on land use, including contamination and disruptions of the ecosystems of adjacent lands, and land disruptions by fuel-cycle-related accidents.
Keywords
Land occupation; Transformation; Renewable; Photovoltaics; Coal; Biomass; Wind; Nuclear
1. Introduction
The potential role of renewable-energy sources, such as solar electric and wind power, is becoming increasingly important as they offer numerous advantages over non-renewable, conventional energy sources in terms of environmental health and safety. Still, critics often charge that renewable-energy sources require large amounts of land compared to conventional energy-generation options; hence, deem them inadequate to resolve the foreseeable crisis of climate change. Our review revealed quite contrasting results on this topic from various sources, and that the number and scope of such sources were limited. Gagnon et al. [1], estimated land use as 45 km2/TWh for the photovoltaic (PV)-fuel cycle compared to 4 km2/TWh1 for the coal-fuel cycle; however, they did not include in the latter surface mining and indirect land use by underground mining. Further, the International Energy Agency (IEA) [2], and Pimentel et al. [3] reported that the former requires 7–17 times more land than the latter to produce unit of electricity per year. Other life-cycle-based land assessments [4], [5], including Ecoinvent, a major commercial database [6], and a study commissioned by the U.S. Department of Energy [7] gave contrasting figures, namely, that conventional energy sources, such as coal and natural gas, require comparable amounts of land as does PV throughout their life cycles.
Admittedly, the scarcity of data and the different metrics employed in each study add more complexity to discerning actual land use in different fuel cycles. A variety of land-use metrics were devised to support environmental impact assessment, risk analysis, and policy decision-making. The life cycle assessment (LCA) for a process- and product-level appraisal commonly measures “life-cycle land use” via metrics that are parsed into land transformation (unit: m2), and land occupation (unit: m2 × year). The former indicates the area of land altered from a reference state, while the latter denotes the area of land occupied and the duration of the occupation. Incorporating static- or dynamic-land quality information into these metrics resolves the impact of the full life cycle from land use [8]. Current information is considered too incomplete to accurately describe the potential for ecosystem damage or land-quality indicators of the specific type of land use [8], [9], [10].
We review in this study the life-cycle land use for renewable-fuel cycles, i.e., wind, photovoltaic, hydroelectric geothermal, and biomass, and for conventional fuel cycles, i.e., coal, nuclear, and natural gas. It is based on our analyses of the literature and actual data. Our assessment of land use employs land transformation and occupation metrics, thus accounting for both direct- and indirect-usages. For the latter, which is linked with materials and energy use, we employed the Ecoinvent database that includes land transformation and occupation factors associated with their usage [6]. Finally, we added a comparative analysis for energy options in terms of the metrics examined.
2. Land transformation
2.1. Coal
The coal-fuel cycle affects the pattern of land use both directly and indirectly during the stages of mining, beneficiation (extraction process), and electricity-generation. Coal mining transforms the existing landscape, destroys the soil, and removes ground vegetation, all direct effects of land use. Furthermore, the usage of materials and the energy for operating coal mines and building infrastructures requires additional land during the upstream processes—indirect land use. Further, there are secondary land disturbances (not quantified in this study) that are due to pollutants and effluents from the coal-fuel cycle, such as water contamination, land acidification, and deterioration of forests. They are caused primarily by acid or alkaline drainage, dust, and soil erosion from coal mines, and by pollutant emissions from coal power plants.
2.1.1. Direct land transformation
Table 1 presents the land area transformed during coal mining, and the conditions assumed for this estimation. The size of land transformed varies with factors, including the coal’s heating value, seam thickness2, density, and the mining method. Disturbed areas are related reciprocally to the seam’s thickness, particularly in surface mining3. In the U.S., about 70% of coal is mined at the surface [11], stripping mountaintops and changing contours. The comparable amount of land for underground mining is undetermined, although the surface area disturbed is smaller than in surface mining. The major concern in underground operations centres on land subsidence or slumping around coal-bearing fragile lands, including roads, dwellings, and national forests [12]. Land is required for many facilities in operating a coal power plant, including a powerhouse 4, switchyard5, stacks6, precipitators7, walkways, coal storage, and cooling towers8. A 1000 MW plant in the U.S. requires between 330 and 1000 acres [13] that translates into 6–18 m2/GWh of transformed land based on a capacity factor of 0.85. Furthermore, a coal-fired power plant in this country generates during its operation a significant amount of ash and sludge. Disposing of the solid wastes accounts for 2–11 m2/GWh [13]. Summarily, we estimate 6–33 m2/GWh of land transformation for the entire operation (Table 2).

Recent data on land areas disturbed by surface coal mining gives the national average figures. Table 3 shows the acreages permitted for surface coal mining and reclaimed [11], [18]. Normalizing these values by annual coal-production figures allows us to estimate the extent of land areas transformed. According to the Surface Mining Control and Reclamation Act of 1977, to obtain a coal-mining permit, applicants must pay the federal- or state-government a certain performance bond, or deposit it with a land-reclamation plan. After closing the mine and completing the planned reclamation, the regulatory authority inspects and evaluates the work to decide about releasing the bond [19]. Reclaiming typically includes backfilling, regrading, establishing drainage control, and re-vegetation. Reclaiming the mined land and receiving back the bond typically requires around 5 years, but reverting to the original, native landscape and its productivity, especially that of forests, is very difficult and necessitates substantial effort and time. For example, although the current reclaiming practice in the U.S. Appalachian region that is populated by woody species, tolerant of harsh physical- and chemical-conditions, could address short-term concerns of erosion and acid-mine drainage, it would take 200–300 years before the composition of native forest was reestablished [20]. Nonetheless, we assumed for our analysis that the acreage of bond released in Table 3 represents land returned to its original state. Because of the time lag between granting permission and the final release of the bond, the amount of land that was actually mined, and thus transformed for a given year is not completely clear. Indeed, permissions are cancelled if the mining operation does not start within 3 years of permission, partially explaining the difference between the permitted and reclaimed areas. Overall, the estimates of the range of land transformation (i.e., 300–784 m2/1000 t) in Table 3, overlaps the original estimates for the Eastern U.S. and the Appalachian region in Table 1.

2.1.2. Indirect land transformation
We used the land-transformation factors in the Ecoinvent database [6] to assess indirect land transformation from the materials and energy requirements for mining and operating the power plant [6]. For underground mining, wood usages account for the majority of indirect land transformation, which reflects the forest area needed to grow those timbers (Table 4). The estimates vary with the region of country mined. The higher usage of timber in the Eastern U.S. than in the Western U.S. is because leaner coal seams are found in the former area [21]. As shown in Table 4, for surface mining, the indirect effects from materials and energy usage are lower than those from underground mining.

2.2. Nuclear
We analyzed both the direct and indirect land transformation for the U.S. nuclear-fuel cycle. Data on the energy and materials inputs for each stage were adapted from U.S. DOE’s characterizations of the nuclear-fuel cycle [22]. We subsequently converted these values to land-transformation equivalents based on the Ecoinvent database [6]. The land covered by nuclear power plants accounts for the largest land transformation (Fig. 1). Since most uranium is imported from outside the U.S., either in the form of uranium ore or enriched fuel, the land-transformation data may not represent the reality of the countries that export them. The land use of a nuclear-power plant itself is higher than that of a coal-fired plant probably because it adds an exclusion area and a barrier space reserved for a possible accident. Although a permanent storage for spent nuclear-fuel has not been constructed, we estimated the land transformed per GWh of electricity generated based on the planning of the Yucca Mountain repository that will accommodate the spent fuel generated in the U.S. until 2011. To meet the Nuclear Regulatory Commission’s licensing requirements, an area of 150,000 acres will be permanently withdrawn, isolating the site from the public [23]. By 2011, the total amount of electricity generated by nuclear power plants in this country will reach around 21,000 TWh [24]. Accordingly, disposal of the spent fuel will necessitate 29 m2/GWh of land (Fig. 1). Additional land may be required for storing low- and mid-level wastes. Lack of data precludes a quantification of the land requirement.

2.3. Natural gas
The natural-gas fuel cycle consists of extracting, purifying, transporting, and storing fuels, followed by electricity generation. The data on energy and materials usage are taken from the DOE’s description of the natural-gas fuel cycle [22], which we subsequently converted into land-transformation equivalence using the Ecoinvent database [6]. The on-shore extraction method requires a significant amount of direct and indirect land use (Fig. 2). The latter is primarily (>90%) related to using diesel-fuel for drilling 1500 m deep with a 67% chance of success for each of the 120 gas wells, a typical size for a single production field. On the other hand, off shore extraction, accounting for around 20% of the U.S. volume produced between 2002 and 2006, entails negligible land transformation although encompassing a large area of water surface (140 m2/GWh) [22], [25]. For the gas-transmission stage, we assumed that 970 km of underground pipeline is constructed [22]. A swath of land some 20 m wide above the pipeline is designated as “right-of-way” for gas transmission to ensure the public’s safety, thereby prohibiting land development and limiting activities on it [26]. We note that natural gas often is stored in depleted gas wells, so that adding the area of land transformation for gas storage to the total may constitute double counting. The direct land use for a natural-gas power plant is smaller than that required for a coal-fired plant probably because large structures are not required for fuel storage or emission-control equipment.

2.4. Solar
Recent progress in PV module and balance-of-system (BOS) technologies demonstrated that a large-scale solar electric power plant could provide electric energy at a competitive cost in the near future. A good example is Tucson Electric Power’s (TEP’s) 4.6 MWp PV plant in Springerville, AZ [27] that we used in this study to model the land area required. The PV-fuel cycle consists of materials acquisition, module production, operation and maintenance, and material disposal. We estimated the direct land use for ground-mounted solar PV based on the configuration of TEP’s plant [28] (Table 5). For a typical ground-mounted configuration, land is required in addition to that accommodating the PV module area, for access, maintenance, and to avoid shading. We used an insolation of 1800 kWh/m2/year, the U.S. average, and 2400 kWh/m2/year, an insolation representing the U.S. southwest where commercial power plants are likely to be located. For concentrator PV, the array design of a proposed 1 MW plant in Byron, CA, of expected system efficiency of 20.2% has been modeled based on a typical direct normal irradiance with tracker in the Southwestern U.S., 2500 kWh/m2/year [29], [30], [31]. We also listed the land use estimates of concentrator PV and thermal power plant from previous reports [32], [33]. Unlike conventional non-renewable technologies, the solar electric-fuel cycle generates electricity without fuel extraction. Therefore, the electricity generated from a given area of land cumulates proportionally to the lifetime of the solar power plant. Its lifetime will be virtually infinite, as no major structures or machines, for example, generators, reactors, or cooling systems, need to be demolished for safety or economic reasons. Nonetheless, a lifetime of 30 years and 60 years was used for this analysis, representing, correspondingly, the life expectancy for the PV module and structural components of the BOS in the TEP plant [27]. Indirect land usages are assessed from the life-cycle inventories of the PV modules and BOS components given in recent publications [27], [34], [35], along with the land-use factors from the Ecoinvent database [6]. The effect of indirect land use, which related to the life-cycle usage of energy and materials is insignificant compared with the direct effect. The indirect land area transformed for multi-, mono-, and ribbon-Si is estimated as 18.4, 18, and 15 m2/GWh, respectively, using an insolation of 1800 kWh/m2/year and 30 years of power-plant lifetime. Additionally, we determined an indirect land use for balance-of-system as 7.5 m2/GWh based on the same conditions.

2.5. Wind
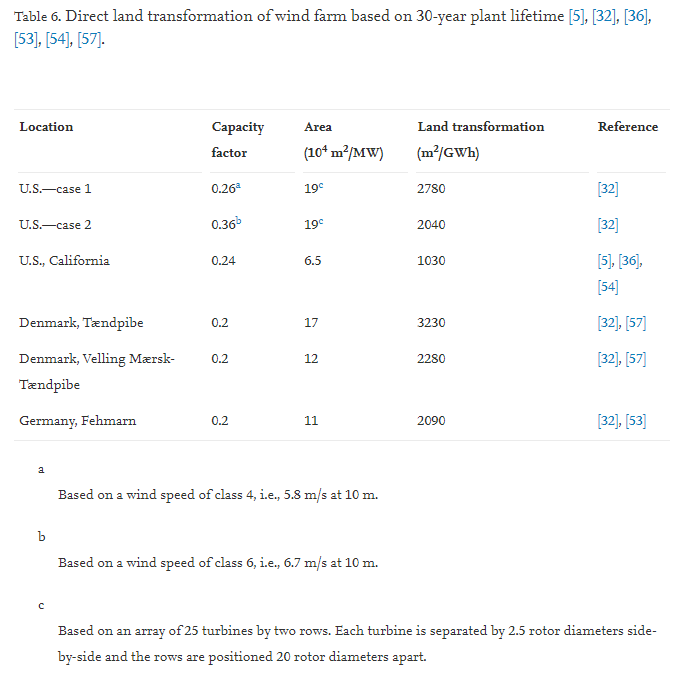
The necessary land area for wind power varies with the turbines’ spacing and their configuration. The land required for a GWh of electricity from wind turbines typically is larger than that needed for the solar-electric cycle (Table 6). The U.S. cases 1 and 2 in Table 6 represent configurations of two rows with 25 turbines per row, a distance of 2.5 rotor diameters side-by-side, and 20 rotor diameters between rows [32]. Depending on the resource availability and terrain, wind turbines use only 1–10% of the wind farm areas [32], [36]. The remaining free lands typically are utilized for grazing, agriculture, and recreation. We estimated indirect land transformation from two LCA studies for an on-shore wind farm in Denmark. We adopted the materials and energy inputs given by Schleisner [37] and Vestas [38] along with the Ecoinvent database. The former source, based on 0.5 MW wind turbine, results in 5.5 m2/GWh while the latter, based on 1.65 MW wind turbine, gave 1.84 m2/GWh assuming a 30-years lifetime [6], [37], [38].
2.6. Hydroelectric
The land required for generating hydroelectric power varies significantly according to site-specific conditions. Water reservoirs in flat contours are likely to be long and large, while higher and shorter dams in mountains may need less land. In addition, reservoir type-hydroelectric power plants require a significant amount of land area for the water reservoir, while the run-of-river type of hydroelectric power plants occupies a much small area as they do not need a reservoir. Table 7 provides some estimates for hydroelectric power plants in North America. We estimated the indirect land use from Pacca and Horvath’s [39] data for constructing the Glen Canyon Hydroelectric Plant. Applying the land transformation factors for concrete, steel, copper, and aluminum in the Ecoinvent database results in an area of 13.6 m2/GWh [6], [10], [39].

2.7. Biomass
Electricity generated from biomass is uncommon yet; it is mostly converted to liquid-fuel (e.g., ethanol) for combustion. The possibility is being explored of growing woody biomass (e.g., willow and poplar) for generating electricity. Table 8 lists the direct land use for producing ethanol and electricity derived from major biomass life-cycle studies. The land area needed primarily depends on the growth rate of biomass that varies with soil, climate, and species. The woody crops for electric-power plants, willow and hybrid poplar, typically yield more biomass from unit area than food crops like corn and soybean if their residues are not harvested. But generating electricity from the former is less efficient than converting the latter to ethanol through “biorefinery”; biomass power plants convert only 23–37% of biomass energy content into electricity [10], [32], [40] while ethanol contains 53–56% of biomass energy content [41], [42], [43], [44], [45], [46]. In addition to the crop land, a biomass power plant requires 7–11 m2/TJ of area assuming a lifetime of 30 years [32]. The indirect land usages are calculated from materials and energy input data (Table 9); they are insignificant compared to the direct-usages [40], [45], [59].


2.8. Comparative analysis
Fig. 3 illustrates representative examples of the total land-area transformation across electricity-generation options. We consider the entire life cycle stages, i.e., extracting resources, generating the electricity, disposing of the waste, and both direct- and indirect-transformations. As shown, the land requirements are diverse within a technology, depending on regional conditions and the technologies adopted. The photovoltaic-fuel cycle transforms the least amount of land per GWh of electricity generated among the renewable technologies we assessed. Notably, over a 30-year timeframe, the land areas transformed by PV-fuel cycles are comparable to those of the natural-gas fuel cycle and less than most coal-fuel cycles coupled with surface mining. Further, integrating PV modules within buildings or structures will disturb indirectly only a minimal amount of land, mostly associated with materials- and energy-usages for producing PV modules. Except for the fuel cycle, renewable technologies transform more land than does conventional electricity technologies under the conditions described. However, we caution that the matrix of land transformation alone cannot characterize the real land-use impacts since it does not convey the duration of land use and recovery, and any functional degradation.

We also note that the land-use profile for renewable technologies changes with the timeframe chosen for assessing transformed land and energy generated. Fig. 4 illustrates the effect of the power plant’s lifetime in measuring the land required by plotting the land transformed against the lifetime of a power plant using renewable-energy technologies. Unlike conventional-fuel cycles, the land transformed per unit electricity gradually will become smaller with increasing plant operation time as the transformed area is normalized by the amount of cumulative electricity generated over the years. However, land transformation will not approach to zero; as shown for the PV cycles, land will be transformed indirectly by periodically producing components (e.g., PV modules) to replace old ones.

3. Land occupation
The land occupation metric involves the duration over which the area of the transformed land returns to its original state, typically measured as a product of land area (m2) and time (year). Estimating the time needed to recover the full productivity of land is complicated, and even more so is defining full recovery. Moreover, as shown in Table 10, restoration time is highly variable depending on the ecosystem disrupted.

For conventional fuel cycles, such as coal- and nuclear-fuel cycles, the land occupation per unit electricity generated will be very sensitive to the length of recovery for disturbed areas. Fig. 5 illustrates the contrasting occupation patterns between conventional- and renewable-energy systems. The full recovery of forest productivity in coal-mined lands in Eastern U.S. is expected to be several hundred years under the current practice of reclamation that focuses on safety and preventing contamination [20]. We assume that the reclamation period for coal-mine land is 30 years for the reference case, and 250 years for the maximum case [20]. Safely sequestering spent nuclear-fuel would need around 10,000 years of land occupation [23], that is, the half life of nuclear radiation from fission products and actinides. As shown in Fig. 5, biomass farming (willow, high-pressure gasification) entails the greatest land occupation, 380,000 m2 year/GWh, followed by nuclear-fuel disposal, 300,000 m2 year/GWh (=30 m2/GWh × 10,000 year). We note that the nuclear-fuel cycle demands a high degree of land occupation, something that is not shown by accounting for land transformation only. The land occupation of surface coal mining varies between 1290 m2 year/GWh for Wyoming (43 m2/GWh × 30 year), and 25,200 m2 year/GWh for Kansas (840 m2/GWh × 30 year). A PV power plant with 13% efficient modules requires 9900 m2 year/GWh of land occupation.

Land occupation of renewable-energy sources, such as PV and wind, remains unchanged per unit electricity generated over the duration of land use. By contrast, for conventional-energy sources that entail non-renewable land usage, a certain amount of electricity generation is correlated with a certain land area increasing occupational time does not translate to increasing electricity. Another feature of land occupation for renewable energy is the interchangeability between area (m2) and time (year). For example, occupying 1 m2 of land for 10 years would produce the same amount of electricity as occupying 10 m2 of land for 1 year. As depicted in Fig. 5, the longer the time that certain land is used for generating renewable energy, the lower is the land requirement. In contrast, the land requirement of conventional, fuel-based power generation is relatively independent of occupation time.
4. Discussion
This analysis does not include the secondary effects associated with land exploitation for some fuel cycles that are difficult to quantify. For example, surface mining gradually disturbs the natural balance of forests, causing a loss of original characteristics by increasing the open area near the forest. Water contamination from coal and uranium mining and pile of uranium-mill tailings would alter adjacent lands. On the other hand, land transformed accidentally by disasters in the nuclear-fuel cycle can change these figures dramatically. The Chernobyl accident contaminated 80 million acres of land with radioactive materials, irreversibly disturbing 1.1 million acres of farmland and forest in Belarus alone [47].
In the U.S., the Surface Mining Control and Reclamation Act of 1977 aims to minimize the impacts of land use from mining by requiring reclamation of used land and stringent emission controls. Restoring lands to their original states takes decades and high economic investments. Completely restoring coal-mined lands often is infeasible; thus, for example, forest is transformed to flat contour for industrial- or residential-areas after mining stops [48]. Moreover, coal-mine lands abandoned before 1977 pose continuing hazards to local residents as state laws that then regulated surface mining were ineffective [49]. The inventories of these abandoned coal-mine lands are available in the website of U.S. Office of Surface Mining Reclamation and Enforcement (OSMRE) [50]; they are not included in our analysis because mines will not be abandoned under the current law and mining practices.
A recent study showed that mountaintop removal mining in Appalachia (strip mining) alters the landscape characteristics of interior forest in a large area i.e., 1.75–5.0 times more than the direct loss of forest [51]. Such activities change the boundary between open land and forest, so disturbing the provision of natural ecological factors (sunlight, nutrients, moisture) to interior forests and eventually modifying the type of thriving habitats. Sunlight and wind penetrate much more, drying out the interior of the forest close to the edge and encouraging the rampant growth of opportunistic species at there. Air temperature, vapor-pressure deficit, soil moisture, light intensity, and levels of photosynthetically active radiation all change at edges, thereby illustrating the complexity of the effects of secondary land use, and warranting further assessment of land use in surface coal mining.
The land use of renewable-energy sources, like PV, wind, and biomass, pose distinct features from conventional fuel cycles in that they use land statically. Once the infrastructure of renewable-energy technologies is constructed, there is no need for further extraction of resources. Moreover, PV- and wind-power-plants can be located on low quality lands (e.g., brownfields), and often be used for multiple purposes (e.g., grazing, shading [52]). On the other hand, fossil- or nuclear-fuel cycles continuously must transform some land in search of fuels. To restore the disturbed land, reclamation projects have been in place for many areas in the U.S. However, as discussed above, restoring land and its productivity to the original state may take a long time and often is not possible. In many cases the land is safely restored, but transformed into a different contour that is suitable primarily for residential- or industrial-areas [48]. Our purpose in this work was not to determine the economic- or ecological-productivity of the transformed land although understanding the dynamics of land-quality restoration either by humans or naturally would enable measurements of the land occupation indicator.
Finally, as shown in Fig. 6, PV uses land more efficiently than coal to generate electricity. The statistics compiled by the Office of Surface Mining Reclamation and Enforcement state that the total area permitted for coal mining in the U.S. ranges from 5 to 8 million acres [50]. Among them, over 1 million acres are defined as having “disturbed” status and are under reclamation (Fig. 6(a)); the rest may be under active mining or in preparation for it. We estimated the amount of electricity that PV technology can generate in 1 year on those permitted acreages. Fig. 6(b) shows that the PV-fuel cycle with an insolation of 2400 kWh/m2/year and 13% conversion efficiency will produce, on average, 40% more electricity than the coal-fuel cycle from the same area of land; with the U.S. average insolation, 1800 kWh/m2/year will generate a comparable amount of electricity to the coal-fuel cycle [11], [50]. Further, as discussed in this study, an increasing area of land will be permitted and disturbed for coal mining in the future, while PV technology would not trigger further land transformation.

- Conclusions
Our study reviews and updates the land-transformation metric for conventional- and renewable-fuel cycles for generating electricity. We show that the PV life cycle of power plants in the U.S. Southwest involves less disturbance of land than do conventional and other renewable-fuel cycles. Even under average U.S. solar irradiation, the land requirement of PV is not greater than that of coal-based fuel cycles. In contrast to the fossil- and nuclear-fuel cycles, PV will not disturb land by extracting and transporting fuel to the power plants. Furthermore, PV eliminates the necessity of reclaiming mine lands or securing additional lands for waste disposal. Biomass energy, on the other hand, competes with agricultural products for land, and due to its low energy-production efficiency, it requires significantly more land than PV. Accounting for secondary effects, including water contamination, change of the forest ecosystem, and accidental land contamination will make the advantages of the PV cycle even greater than those described herein. Further investigation will be necessary to assess these impacts on a regional- and global-level.
10¹², TW⋅h, terawatt-hour, /terə/ ↩︎
A coal seam of around 3–4 m thickness is, generally, observed to provide normal working height for efficient extraction and is suitable for most of the conventional mining methods. Considerable increase in thickness of a coal seam makes it challenging for efficient underground mining and is called thick. ↩︎
Surface mining, including strip mining, open-pit mining and mountaintop removal mining, is a broad category of mining in which soil and rock overlying the mineral deposit (the overburden) are removed. In contrast to underground mining, in which the overlying rock is left in place, and the mineral removed through shafts or tunnels. ↩︎
The structure that houses generators. ↩︎
Switchyard is the point in the power network where transmission lines and distribution feeders or generating units are connected through circuit breakers and other switchgears via bus bars and transformers. Switchyard acts as interface between the power plant electrical system and electrical grid. ↩︎
A smokestack, stack, or chimney is a tall vertical pipe or channel used by power plants to exhaust combustion gases into the air. ↩︎
An electrostatic precipitator is a type of filter (dry scrubber) that uses static electricity to remove soot and ash from exhaust fumes before they exit the smokestacks. ↩︎
Cooling towers provide an energy efficient and environmentally friendly way of removing heat from this circulating water before it is returned to its source.
In the U.S., the dominant (∼70%) mode of transporting coal from mines to power plants is railroads [14]. In 2001, mined coal accounted for 41% of the total mass and 32% of the ton-miles shipped via Class I large freight railroad carriers [15]. As 2 million acres of land is used for Class I railroads in the U.S. [16], allocating 32% of the land use to coal shipping results in 30 and 80 m2/GWh of land use for the Eastern and Western coal respectively based on the hauling distance to power plants, over a 30-year time frame when normalized by the 1600 TWh of electricity generated from coal in 2001 [17]. ↩︎
