A combined GIS-archetype approach to model residential space heating energy: A case study for the Netherlands including validation
A transferable residential space heating energy model is developed based on geo-referenced data and archetypes.
Table of Contents
Highlights
- A transferable residential space heating energy model is developed based on geo-referenced data and archetypes.
- Model results are spatially validated against measured energy consumption.
- Past refurbishment and occupant behaviour significantly affect model results.
- The model is suited to identify spatial hotspots and assess energy-efficiency measures.
Abstract
High spatial resolution is critical for a building stock energy model to identify spatial hotspots and provide targeted recommendations for reducing regional energy consumption. However, input uncertainties due to lacking high-resolution spatial data (e.g. building information and occupant behavior) can cause great discrepancies between modeled and actual energy consumption. We present a modeling framework that can act as a blueprint model for most European countries based on geo- referenced data, building archetypes, and public algorithms. Further sophistication is added in a step-wise approach, including the shift from average to hourly weather data, refurbishment , and occupants’ heating schedules. The model is demonstrated for the city of Leiden, the Netherlands, and the simulated results are spatially validated against the measured natural gas consumption reported at postcode level. Results show that when these factors are considered, the model can provide a good estimate of the energy consumption at the city scale (overestimated by 6%). At postcode level, nearly 83% of the absolute differences between modeled and measured natural gas consumption are within one standard deviation (±25 kWh/m2a, about 30% of the mean measured natural gas consumption). Further research and data would be required to provide reliable results at the level of individual buildings, e.g. information on refurbishment and occupant behavior. The model is well suited to identify spatial hotspots of residential energy consumption and could thus provide a practical basis (e.g. maps) for targeted measures to mitigate climate change.
2. Materials and methods
2.1. Model overview
In order to develop a building stock energy model and simultaneously investigate the effects of various factors on the modeled energy consumption for space heating, we stepwise simulate the energy consumption with increasing model sophistication. Step 1 (S1) uses the seasonal heat demand calculation method while S2-4 employ the hourly calculation approach (see Section 2.3). All steps use the same basic input data, including geometry, physical property, supply system, and occupant-behaviour data other than occupant schedule. S1 uses seasonal average weather data, while hourly weather data is introduced in S2, refurbishment in S3, and occupant schedule in S4, as shown in Table 1.
Table 1. Steps and factors increasing sophistication for the energy consumption for space heating.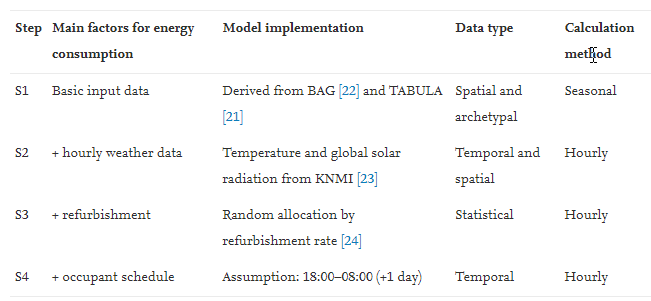
Three principal data sources are used in this study:
(1) The GIS dataset from the Basic Registration of Addresses and Buildings (BAG) contains all official addresses and basic building information of the Netherlands [22]. The main information included in this dataset is the georeferenced building footprint as a polygon, function, year of construction, building height, and registered addresses per building.
(2) The TABULA database (Typology Approach for Building Stock Energy Assessment) contains residential building typologies for 21 European countries including the Netherlands [21]. It distinguishes six construction periods, i.e. before 1965, 1965-1974, 1975–1991, 1992–2005, 2006–2014 and after 2014, and five types of residential buildings, namely single-family house, mid-terraced house, end-terrace house, apartment building, and multi-family house (see Table S1 of supplementary material), and provides archetypical information on their surface areas, the thermal properties of envelope components, and supply systems.
(3) Weather data is from the Royal Dutch Meteorological Institute (KNMI) [23].
These data sources are combined in the four models as shown in Fig. 1. In order to characterize BAG buildings with TABULA archetypes, we first identify the types of BAG buildings, and then automatically map the parameters (typical geometries, physical properties, and supply system parameters) of archetypes to BAG buildings based on construction periods and building types. The following five criteria are employed to differentiate the types of BAG buildings: the number of shared walls, the number of registered addresses, building footprint area, gross floor area, and the number of stories (see details in Table S2 of supplementary material). These extracted parameters, together with the weather data, refurbishment statistics, and occupant-behavior data, constitute the input data for S1-4.

Fig. 1. Schematic overview of the relationships between different databases. The orange denotes data sources. The blue denotes the derived basic building parameters from BAG and TABULA. The red denotes the identified construction period and building type of each building. The purple denotes the derived input data for heating energy models. The pink denotes the calculation methods. The green denotes the outputs of different models. The colors of connection arrows are in line with the latter databases.
IEE Project TABULA (2009 - 2012)
“Typology Approach for Building Stock Energy Assessment”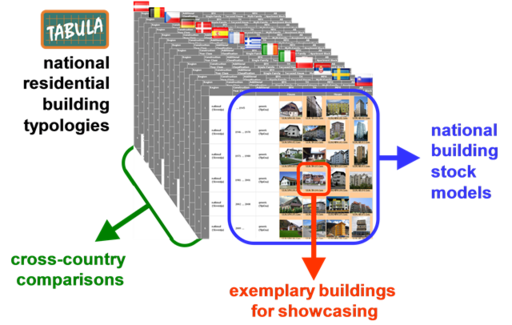
During the IEE project TABULA residential building typologies have been developed for 13 European countries. Each national typology consists of a classification scheme grouping buildings according to their size, age and further parameters and a set of exemplary buildings representing the building types. They have been published by the project partners in national “Building Typology Brochures”, written in their respective languages. As a common element all brochures contain double page “Building Display Sheets” for all example buildings on which energy related features and the effects of refurbishment measures are illustrated graphically.
To exchange information on the European level the “TABULA WebTool” provides an online calculation of the exemplary buildings from all countries, displaying their energy related features and the possible energy savings by implementing refurbishment measures. Basis of the TABULA WebTool is a simple and transparent reference procedure for calculating the energy need, the energy use by energyware and the energyware assessment (primary energy, carbon dioxide, costs).
Apart from the reference calculation used for cross-country comparison a calibration of the calculated energy use to the typical levels of actual consumption is foreseen – with the intention to enable a realistic assessment of energyware and heating costs savings. Based on the residential building typologies building stock models have been created for seven countries which enable a projection of the actual national building stock consumption and the energy saving potentials.
